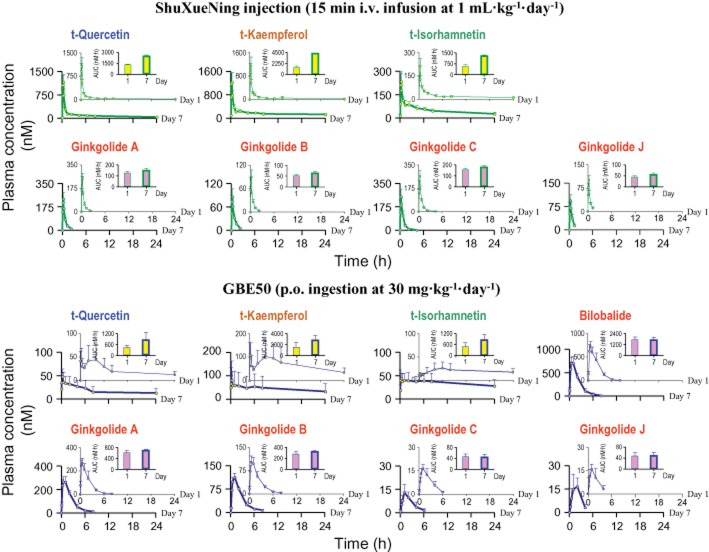
Figure 3.
Plasma concentrations of total flavonols (circles filled in yellow) and terpene lactones (circles filled in pink) over time on day 1 (thin green and blue curves) and day 7 (thick green and blue curves) in rats given subchronic treatment with ShuXueNing injection (1 mL·kg−1·day−1; 15 min i.v. infusion; green curves) or GBE50 (30 mg·kg−1·day−1; p.o. ingestion; blue curves). The upper and smaller inserts for the ginkgo compounds show the comparative AUC0-t values for day1 and day 7.

