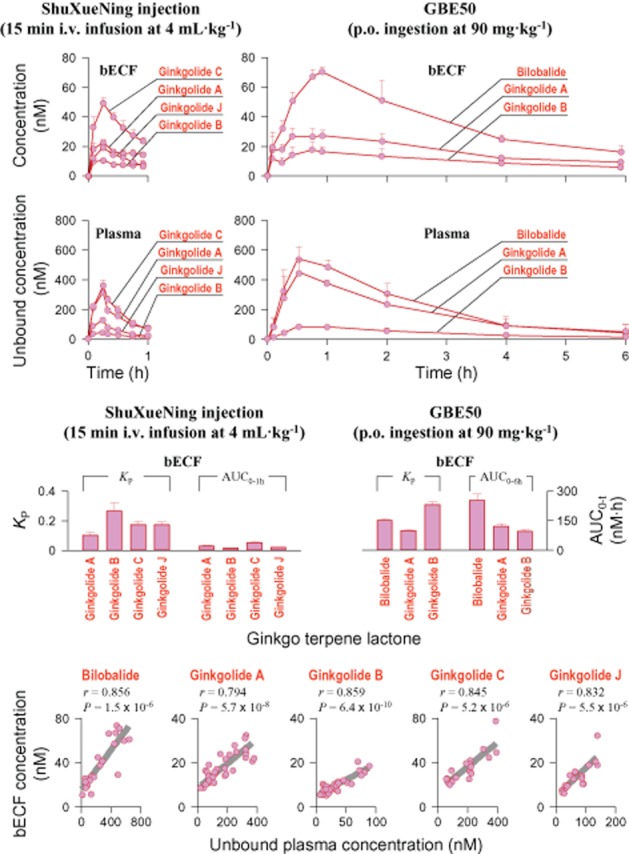
Figure 5.

bECF concentrations and unbound plasma concentrations of terpene lactones over time (upper panel), comparative KP values and comparative bECF AUC values of the ginkgo compounds (middle panel) and correlations between the unbound plasma concentrations and the bECF concentrations (lower panel) after a 15 min i.v. infusion dose of ShuXueNing injection (4 mL·kg−1; red curves) or a p.o. dose of GBE50 (90 mg·kg−1; red curves) in rats. The letter ‘r’ represents the correlation coefficient. Correlations were statistically significant, with a P-value of <0.05.
