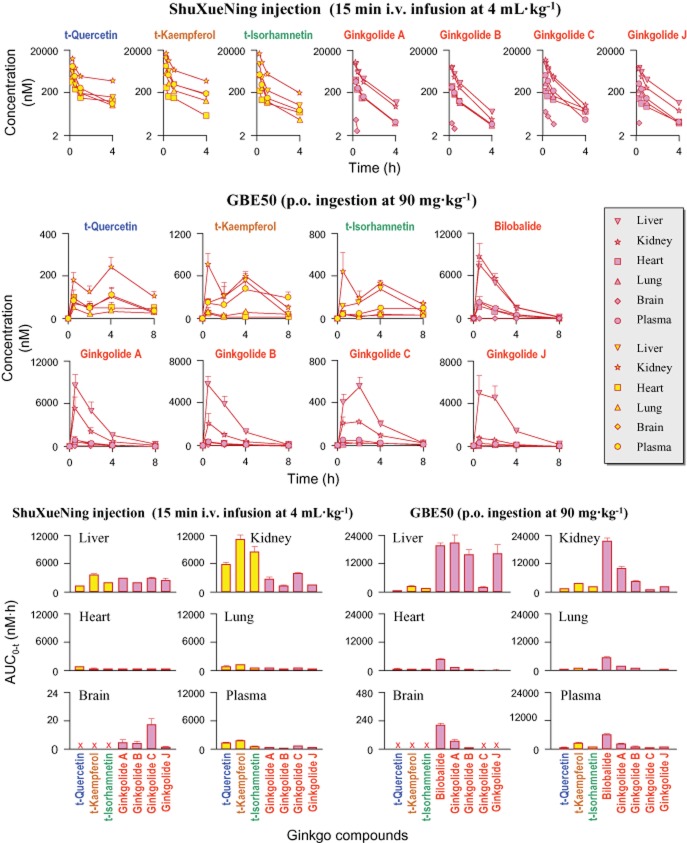
Figure 6.
Tissue distribution of total flavonols (markers filled in yellow) and terpene lactones (markers filled in pink) after a 15 min i.v. infusion dose of ShuXueNing injection (4 mL·kg−1; red curve; upper panel) or a p.o. dose of GBE50 (90 mg·kg−1; red curve; middle panel) in rats. Tissue AUC values and the associated plasma AUC values are shown in the lower panel.

