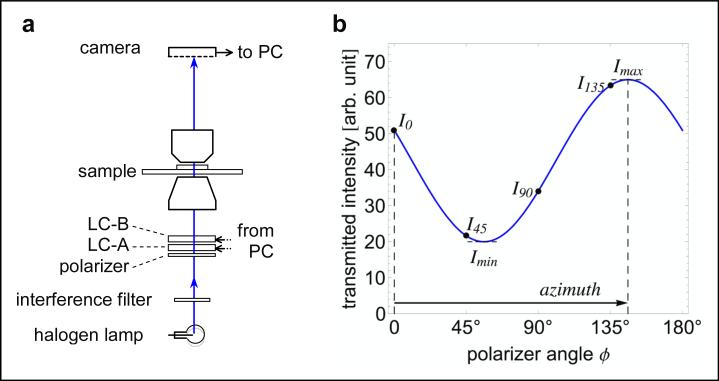
Figure 4.
Diattenuation measurement scheme. The schematic of the optical setup includes the universal compensator (polarizer, LC-A, LC-B) that is used to create linearly polarized light for illuminating the sample. No polarization analyzer is present in the imaging path. (The reverse is possible too, i.e. using unpolarized light as illumination and analyzing the linear polarization of the imaging light.) The graph on the right shows the expected intensity measured in a region of uniform dichroism with a maximum transmittance for light that is linearly polarized at an azimuth orientation of 146°. The solid line is the expected sinusoidal variation when continuously varying the polarization orientation, with intensities labeled for orientations 0° (horizontal), 45°, 90°, and 135°.

