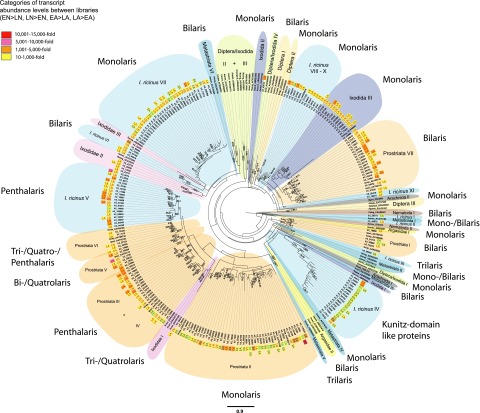
Figure 3.
Phylogram of the Kunitz domain family. Kunitz domain-encoding proteins of hematophagous arthropods, of nematodes (defined by GenBank accession numbers), and of all 4 SG Illumina libraries that were significantly ≥10-fold more frequent in a certain SG library compared to a second SG library (EN vs. LN, LN vs. EN, EA vs. LA, LA vs. EA) were used for phylogenetic reconstruction by ML and bayesian analyses. Abundance levels of each protein from a certain SG library are displayed. The presented ML tree was rooted with Caenorhabditis elegans (GenBank: CAA98467), and only strongly supported nodes with bootstrap values ≥ 50% are shown. Bayesian posterior probabilities ≥ 0.5 are also given for clade nodes that had the same topology in the ML and bayesian phylograms. Scale bar (mean amino acid substitution/site) of the ML tree is at the bottom center of the figure.

