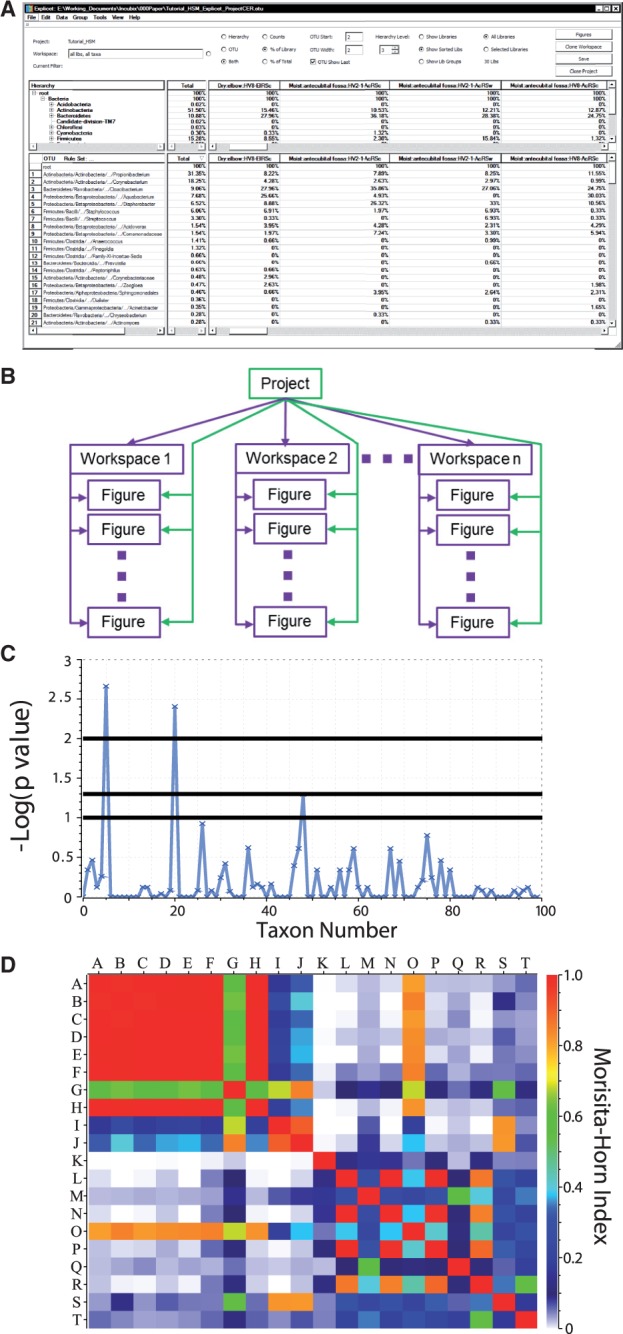
Fig. 1.

Explicet windows displaying a portion of a human skin microbiome dataset (Grice et al., 2009). (A) Explicet workspace window showing the row/column data displays characteristics of an OTU file. The upper pane displays the taxonomic hierarchy of the dataset and individual samples. The lower pane shows the full OTU table perspective on the data. (B) Relationships between data management entities in Explicet. (C) Manhattan plot of a Two-Part (Wagner et al., 2011) non-parametric statistical comparison of samples, indicating that two taxa differ significantly between sample types. (D) Heatmap of Morisita–Horn similarity between samples
