Figure 5.

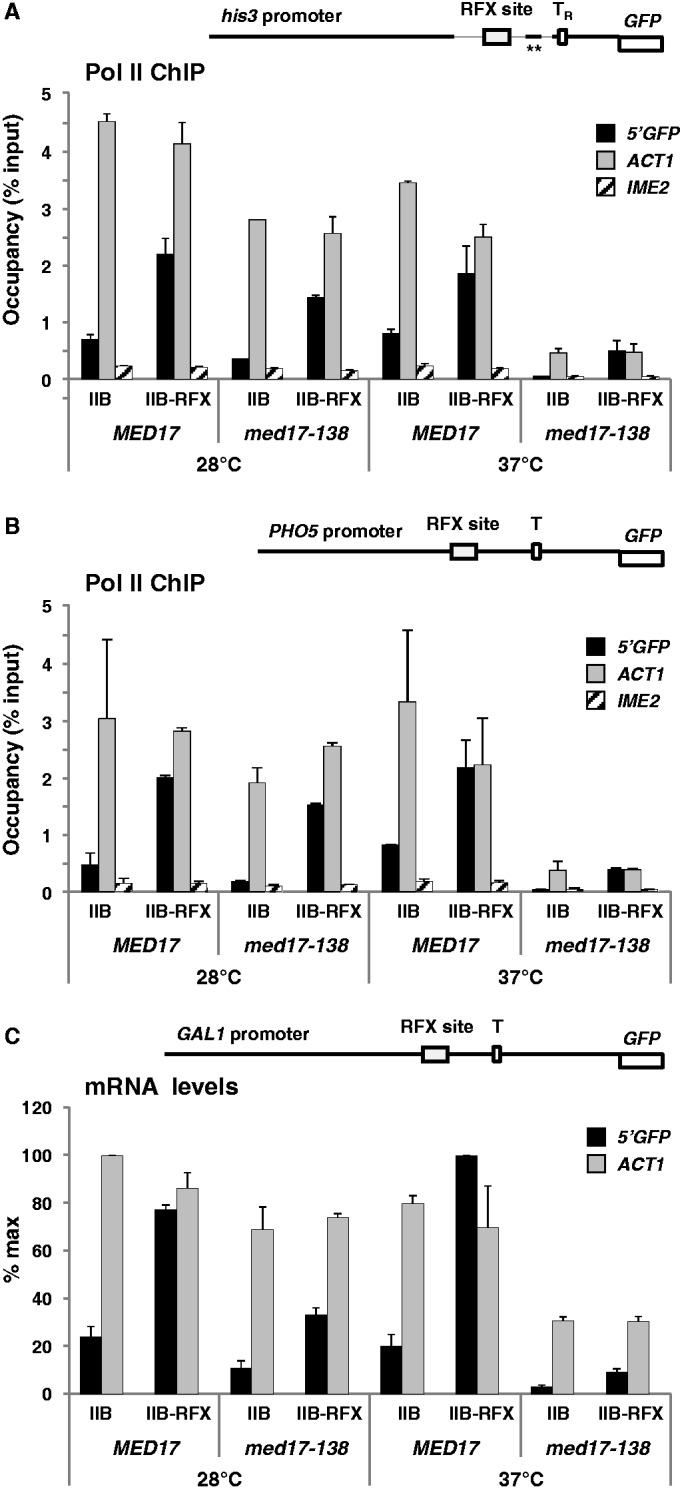
Transcriptional activation by TFIIB-RFX from HIS3, PHO5 and GAL1 promoter derivatives containing the RFX binding site is affected in the med17-138 mutant. (A) Top diagram: schematic representation of the xhis3-GFP test gene containing an RFX binding site 72 bp upstream the canonical TATA element (TR) of HIS3. The thick lines corresponds from left to right to positions −750 to −464, −125 to −108 and −78 to −1 of HIS3, and the asterisks indicate mutations in the Gcn4 binding site. TR is at −70. Graph: Pol II occupancy at GFP, ACT1 and IME2 ORF measured by ChIP. The med17-138 mutant and an isogenic wild-type strain (Y822 and Y823) containing YCp33-xhis3-GFP, and either pRS314-IIB or pRS314-IIB-RFX, were grown in glucose-containing CSM medium at 28°C to early log phase, and were shifted to 37°C. Samples were processed for ChIP analysis as in Figure 4. Error bars represent standard deviations from two independent experiments. (B) Upper diagram: schematic representation of the xPHO5-GFP gene containing an RFX binding site 80 bp upstream PHO5 TATA element. The thick line corresponds to positions −392 to −1 of PHO5. The TATA element is at −101. Graph: Pol II occupancy at GFP, ACT1 and IME2 ORF measured by ChIP. The med17-138 mutant and an isogenic wild-type strain (Y822 and Y823) containing YCp33-xPHO5-GFP, and either pRS314-IIB or pRS314-IIB-RFX, were grown and processed for ChIP analysis as in (A). (C) Top diagram: schematic representation of the xGAL1-GFP gene containing an RFX binding site 67 bp upstream of the GAL1 TATA element. The thick line corresponds to positions −500 to −1 of GAL1. The TATA element is at −147. Graph: RNA levels for xGAL1-GFP and ACT1 quantified by RT-qPCR as shown in Figure 1. Error bars represent standard deviations from two independent experiments.
