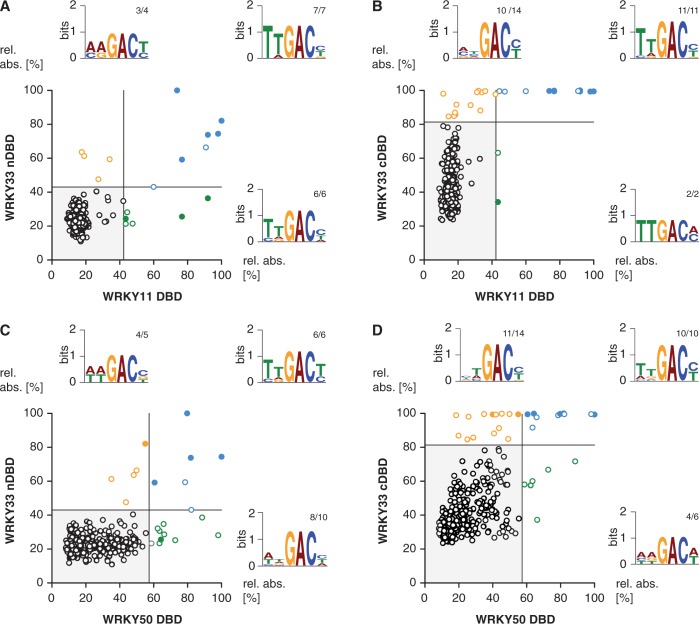
Figure 4.
Comparison of the DNA-binding specificities of four AtWRKY DBDs. The XY-plots of relative absorbance values of the DPI-ELISA screens of the DBDs of AtWRKY11 DBD versus AtWRKY33 nDBD (A), WRKY50 DBD versus WRKY33 nDBD (B), WRKY33 cDBD versus WRKY11 DBD (C) and WRKY33 cDBD versus WRKY50 DBD are graphed. The dsDNA probes significantly bound by both the x- and y-component are in blue, those only bound by the respective x-component are in green and those only bound by the respective y-component are in orange. The filled circles indicate probes exhibiting the known ‘TTGACY’ binding motif. Lines indicate the significance threshold (P ≤ 0.05). The sequences of all positively bound probes were used as MEME input for motif identification. Motif consensus was shown as Weblogos; numbers of probes that contain the motif displayed as Weblogo and number of motifs per quartile are indicated as small numbers.

