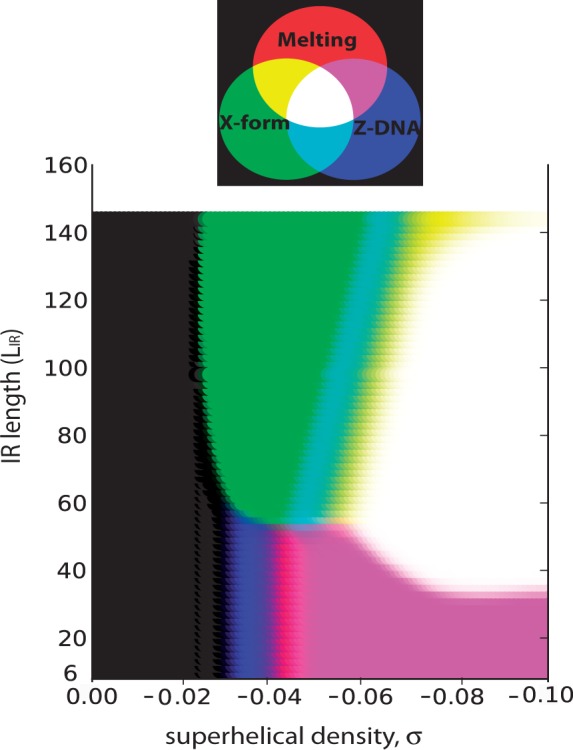
Figure 1.

This color plot shows the probabilities of the three types of transitions as functions of IR length ( ) and superhelix density σ for the model sequence described in the text. The colors correspond to the probabilities of each transition type as shown in the Venn diagram at the top, with the depth of hue increasing with transition probability. Here X-form denotes the cruciform extrusion transition.
