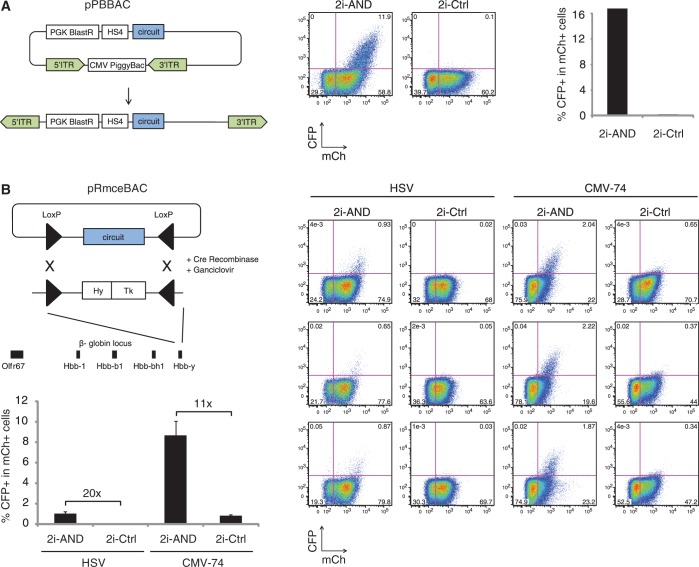
Figure 4.
Characterization of genomically integrated AND circuits. (A) The diagram depicts the pPBBAC system for low-copy, random genomic integration. On transfection, the PiggyBac transposase integrates the DNA circuit located in between two inverted terminal repeat sequences (ITR). A PGK promoter-driven Blasticidin resistance marker allows selection of stable integrants. The flow cytometry scatter plots show CFP and mCh signals after PiggyBac-mediated integration of 2i-AND (left) and 2i-Ctrl (right) in ES cells. The numbers indicate percentage of cells in each quadrant gate. (B) The diagram depicts the pRmceBAC system for single-copy genomic integration. Circuits are integrated by Cre recombinase in a target site in the beta-globin locus that consists of two inverted loxP elements (triangles) flanking a fusion of a hygromycin-resistance (Hy) and a ganciclovir-sensitivity gene (Tk). The flow cytometry scatter plots show CFP and mCh signals of ES cells with integrated 2i-AND and 2i-Ctrl circuits, each containing either promoter variant HSV or CMV-74. Each row displays results for an independent cell clone. The numbers indicate percentage of cells in each quadrant gate. The bar graph shows the percentage of CFP positive in all mCh-positive cells. Error bars indicate standard deviation from three independent cell clones.

