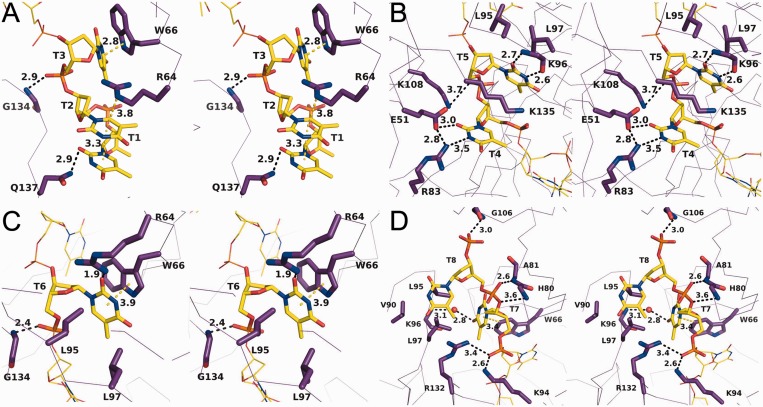
Figure 2.
Stereo-images of DdrB interactions with T1–T3 (A), T4–T5 (B), T6 (C), T7–T8 (D). Protein is represented in Cα form with highlighted residues and ssDNA represented in stick. Amino acid residues (yellow), DNA bases (purple) and interaction distances are labeled (Å). Polar interactions and π-interactions are denoted by black and yellow dashed lines, respectively.

