Figure 7.
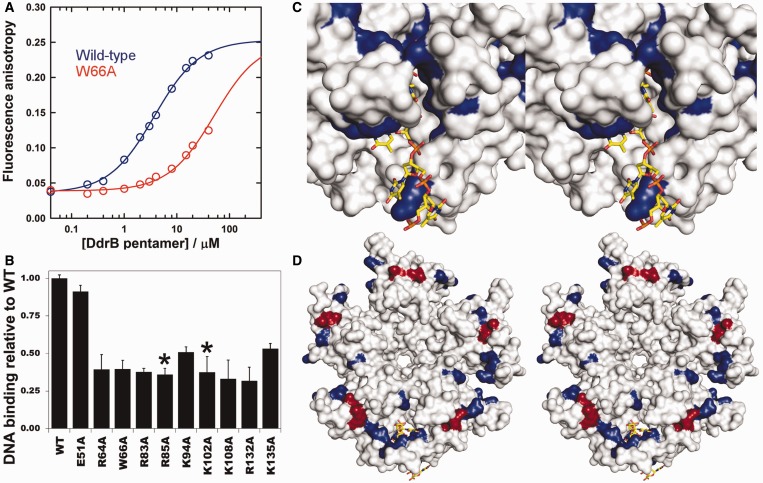
DdrB–ssDNA interactions. (A) Titration of 20b FAM labelled dT with increasing concentrations of wild-type (blue) and W66A (red) DdrB analysed by fluorescence anisotropy. The fluorescence anisotropy of the labeled ssDNA substrate increases as its rotational movement decreases on protein binding. Best-fits to a reversible A (DNA) + B (DdrB pentamer) = AB model, shown as solid lines, return Kd values of 3.6 ± 0.6 µM for the wild-type DdrB and 51 ± 9 µM for the W66A mutant. In the case of the latter, the saturating anisotropy was fixed at the value obtained for the wild-type DdrB. (B) DNA binding of DdrB mutants relative to wild-type DdrB at 3 µM pentamer concentration (error bars represent standard deviation of n = 3 trials). Residues highlighted with a (*) were not observed to interact with ssDNA in the co-crystal structure. (C) Stereo-image of the ssDNA binding surface of DdrB from the crystal-structure. Surfaces coloured in blue represent residues that were subjected to amino acid substitution and displayed decreased binding relative to wild-type. (D) Stereo-image of the ‘top’ face of the DdrB pentamer. Coloured surfaces represent residues subjected to amino acid substitution, which displayed decreased binding relative to wild-type. Residues coloured in blue were observed to form interaction with ssDNA in the crystal structure, while those in red (R85, K102) showed no interaction with ssDNA. The coloured (blue and red) surface defines a possible extended ssDNA binding mode in addition to the one observed within the structure.

