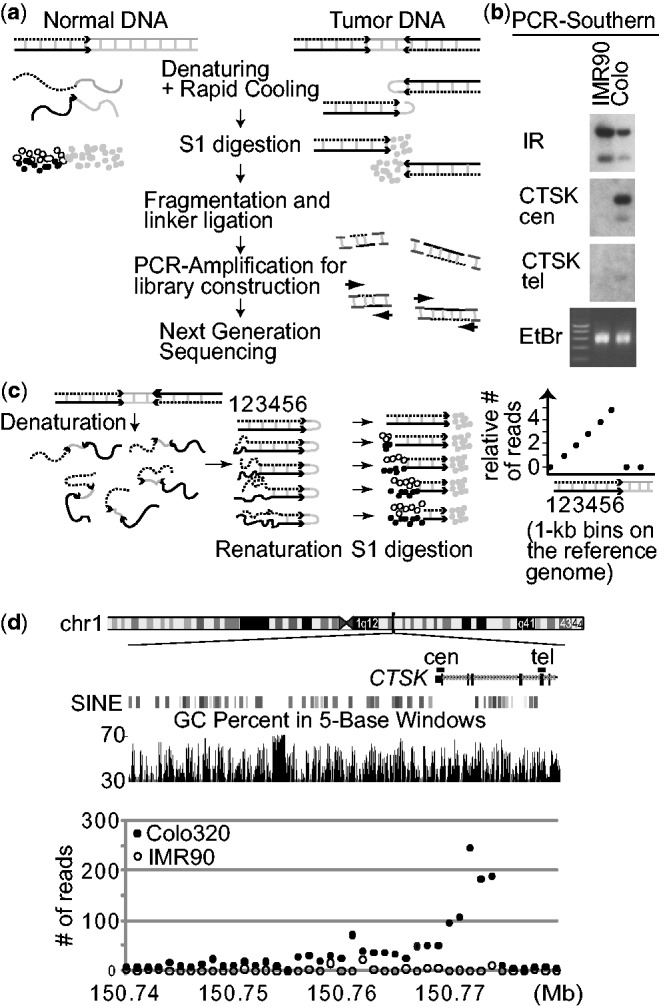
Figure 2.

(a) A strategy for enriching DNA from palindromic junctions. DNA is shown by either a black, dotted, or gray line, with the black and dotted lines being complementary to each other. (b) Southern analyses of the PCR products using probes in the human genome. The locations of probes (CTSK cen and tel) are shown in (d). (i) enrichment is only seen in Colo320DM by probe CTSK cen that is within the palindromic junction, but not by probe CTSK tel, and (ii) probes from a naturally existing DNA inverted repeat at chromosome 19p13.2 (chr19:7049026–7058989 in hg19) showed strong enrichment in both IMR90 and Colo320DM. EtBr, ethidium bromide stained gel. (c) Schematic drawings show that in vitro fold-back of palindromic DNA after denaturation/renaturation and subsequent digestion by nuclease S1 (left) can results in the steady increase in read depth (per 1 kb bin) toward a palindromic junction (right). The numbers indicate 1 kb bins on the reference genome. (d) The numbers of GAPF-reads/kb in Colo320DM (closed circles) and IMR90 (open circles) are shown for the 50 kb region of chromosome 1 where the CTSK gene is located. Two genomic features (GC content and SINE elements) within the genomic region are also shown.
