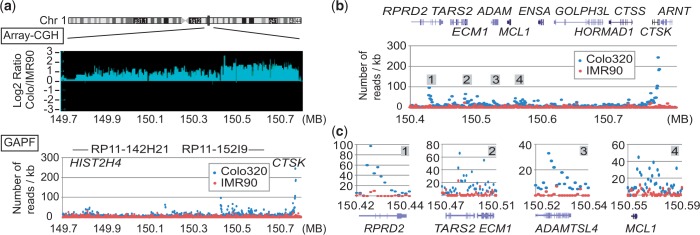
Figure 3.

(a) Copy number ratio (Colo/IMR90, Array-CGH, top) and the numbers of GAPF-reads/kb in the 1.1 Mb region (bottom) of chromosome 1. The numbers of GAPF-reads for Colo (blue circles) and IMR90 (red circles) for each 1 kb bin are shown. The locations of BAC clones used for the probes for FISH (Figure 4a) are shown. (b) The number of GAPF-reads/kb over the 400 kb highly amplified region. Four peaks are marked as 1–4. Genes within the region are shown on the top. (c) The detailed views of read depths for GAPF peaks 1–4.
