Figure 5.

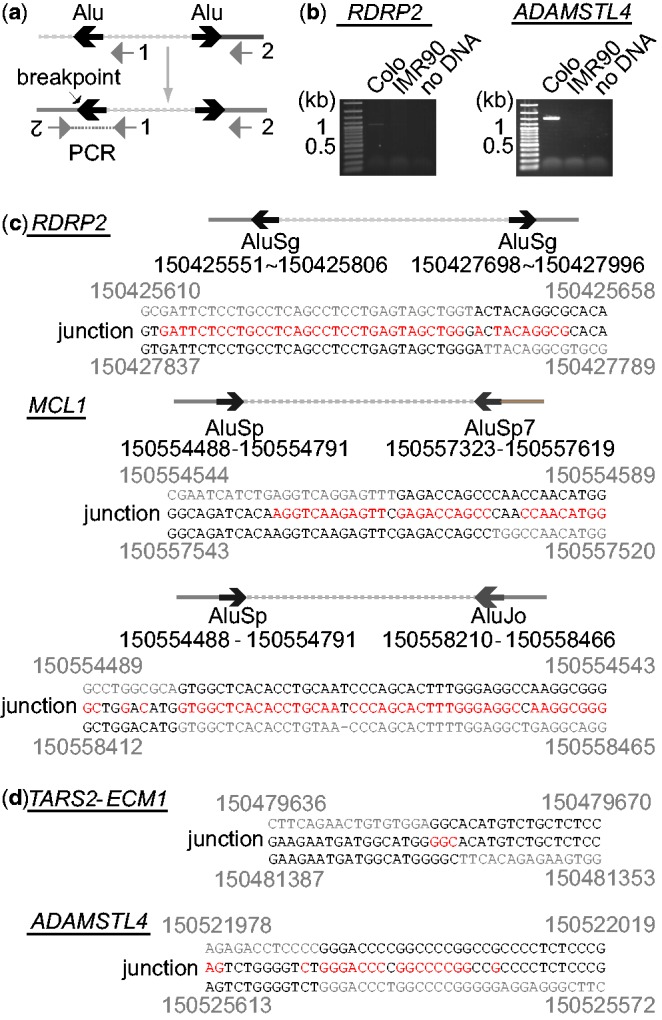
(a) PCR strategy for the amplification of palindromic fusion breakpoints. Lines represent genomic segments. Two PCR primers are indicated by gray arrows. Inverted Alu repeats (or microhomologies) are indicated by a pair of black arrows. (b) Ethidium bromide-stained agarose gels after PCR amplification for RDRP2 and ADAMSTL4 junctions. Normal fibroblast IMR90 DNA was used as a negative control. (c) DNA sequences of palindromic junctions with Alu inverted repeats. The locations (coordinates of chromosome 1) of inverted Alu repeats and the coordinates (top and bottom) of breakpoints and junction sequences (middle) are shown. Sequence homologies are shown in red. (d) DNA sequences of microhomology-mediated palindromic junctions.
