Figure 6.
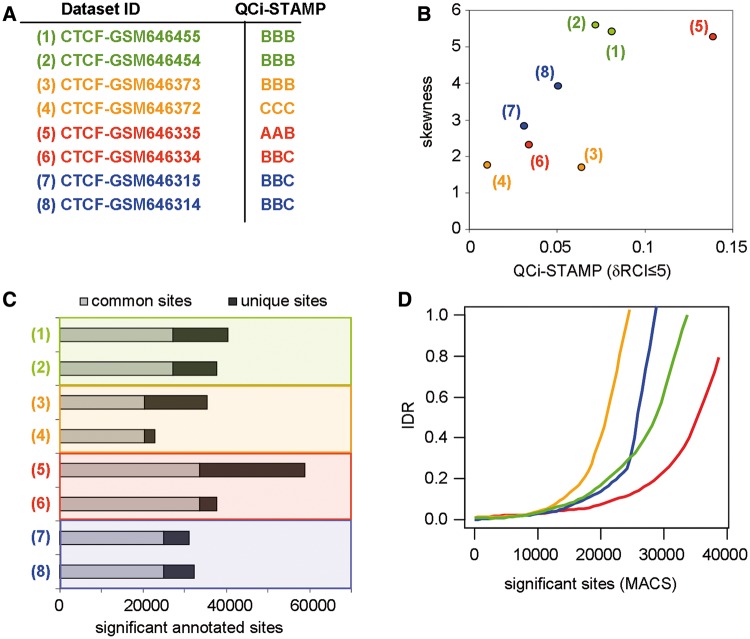
Comparison of QCi-STAMP performance with other analytical methodologies. (A) A set of four biological duplicates was selected from publicly available CTCF ChIP-seq profiles (pairs are enhanced by color code) and their corresponding QCi-STAMP descriptors were inferred (‘A’ for highest and ‘D’ for lowest quality). (B) The skewness of the read-count signal distribution of the biological replicates compared with the predicted QCi-STAMP (dRCI ≤ 5%). Note that the QCi-STAMP descriptors discriminate between data set (3) and (4), while their skewness evaluation does not. (C) Significant binding sites were predicted by MACS (default P-value threshold: 1 × 10⁻⁵) and classified based on their overlap between CTCF replicates (common and unique sites). Common sites were assessed by accepting up to 40-nt distance between MACS-predicted summits. (D) ‘IDR’ among CTCF replicates assessed by sorting significant binding sites according to the corresponding P-value. Note that in agreement with the QCi-STAMP descriptors, but differing with the skewness analysis (see panel C), data sets (3) and (4) present the worst IDR, while data sets (5) and (6) present the best IDR pattern.

