
Figure 1.
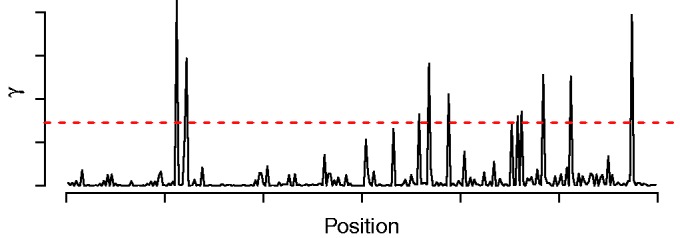
Normalized likelihood profile of a sequence. The red dashed line visualizes the threshold that is used to accelerate the algorithm. All positions with peaks above the threshold are included in  , and all remaining positions are not used for evaluating the likelihood.