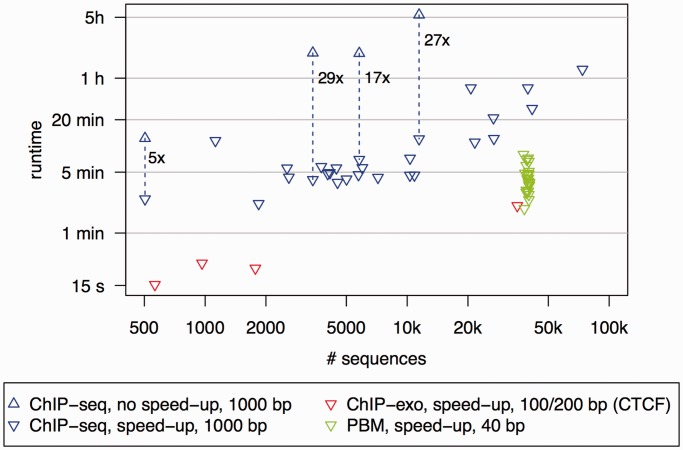
Figure 2.
Runtime evaluation of Dimont on the data sets used in this article. We consider all ChIP-seq data sets (blue), ChIP-exo (red) and PBM (green) data sets used in this article. Upright triangles represent the runtime without the speed-up strategy, whereas reversed triangles represent the runtime using the speed-up strategy. Runtime decreases by a factor of 5 to 29 due to the speed-up strategy.

