Figure 2.
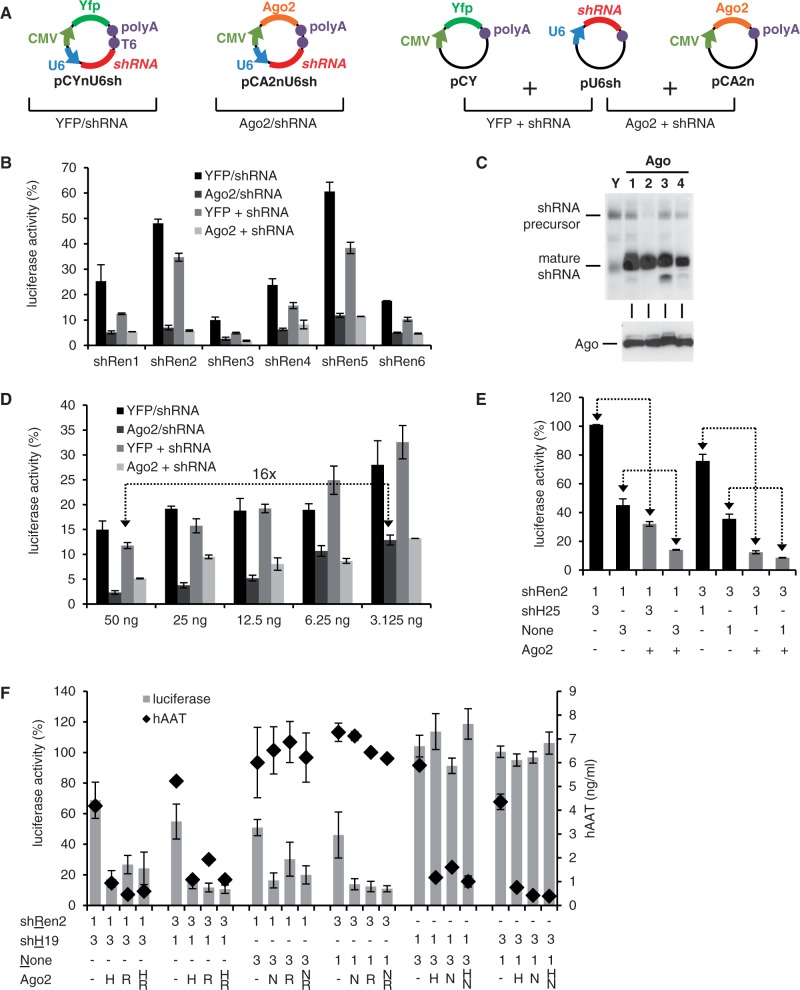
Improvement of shRNA knockdowns by transient Ago2 co-expression in cis. (A) Scheme depicting the principal constructs and experimental settings. (B) HeLaP4 cells were co-transfected with psiCheck2 and plasmids encoding six different shRNAs against Renilla luciferase. In addition, Ago2 or Yfp were co-expressed in cis or in trans (see panel A for all combinations). Renilla luciferase activity was normalized to Firefly luciferase in each sample, and then to that of a nonsilencing control shRNA. (C) Top: Northern blot after shRen3 co-transfection into 293T cells with each of the four human Ago proteins (lane numbers denote Ago1–4) or Yfp (Y) as control. Bottom: Western blot confirming equal Ago protein expression. Note that while all four proteins stabilize mature shRNA strand steady-state levels, only Ago2 moreover improves shRNA precursor processing (evidenced by a reduction of the respective signal in the northern blot). (D–F) Luciferase assays in HeLaP4 cells to study shRNA dose responses and competition. (D) Dose–response analysis in cells transfected with the indicated decreasing amounts of shRNA plasmids. See panel A for data analysis. The arrow symbolizes that Ago2 co-expression permits the use of 16-fold lower shRNA plasmid amounts to achieve the same knockdown as without exogenous Ago2. (E) Combinatorial RNAi experiment in which cells were co-transfected with two plasmids, one encoding an shRNA against Renilla luciferase (shRen2), and the other an irrelevant shRNA (shH25) or none at all. Numbers indicate molar ratios of these two plasmids. In addition, all cells received the psiCheck2 reporter. At the bottom of the legends, Ago2 co-expression from the shRen2 plasmid is indicated by ‘+’, while ‘−’ is the corresponding Yfp controls. The arrows highlight sample pairs with or without Ago2 co-expression to illustrate how Ago2 concurrently improves the efficiency of both shRNAs and relieves their competition. (F) Combinatorial RNAi assay akin to panel E, except that targets for both shRNAs were included (Renilla luciferase and hAAT). Numbers below the graph are molar plasmid ratios, and letters designate the plasmid that encoded Ago2 (see underlined letters on the left). All bars in this figure represent means ± SD (n = 3), except for panel F, where they are means ± SEM (n = 6).

