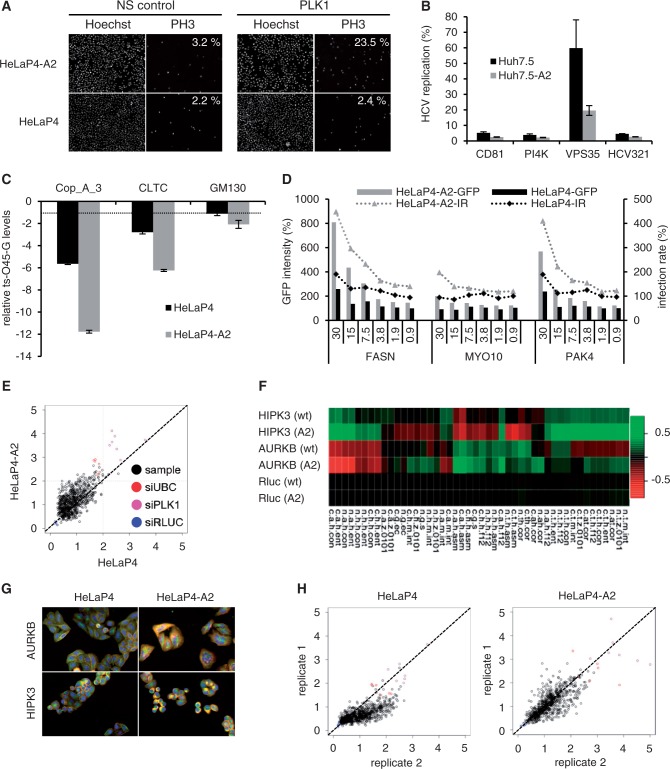
Figure 5.
Stable Ago2 overexpression improves siRNA potencies and associated phenotypes. (A) Visualization and quantification of mitotic cells (phenotypic readout, see ‘Materials and Methods’ section for calculation) after transfection of siRNAs against PLK1 into Ago2-expressing or parental HeLaP4 cells. Note the 10-fold increase in the Ago2 clone (upper rightmost panel). NS, nonsilencing. (B and C) Further examples for more pronounced phenotypes in stably Ago2-transfected cells (gray bars) with siRNAs against HCV host factors (B) or genes encoding proteins involved in vesicle transport (C). See ‘Materials and Methods’ section for assay details. Plotted in (C) are ratios of ts-O45-G protein detected at the plasma membrane versus total protein. The dotted line in (C) denotes the assay threshold (−1.5). Bars are means ± SEM (n = 4). (D) Dose–response analysis of three siRNAs (numbers indicate transfected amounts in nM) against the indicated HIV-1 host restriction factors. Intensity of Gfp expression (encoded by the reporter HIV strain) and infection rates (IR) served as phenotypic readouts. Measured values were normalized to a negative control siRNA. Shown are representative results. Note how stable Ago2 overexpression improved both Gfp expression and infection rates. For assay details, see ‘Materials and Methods’ section and Börner et al. (52). (E) Comparison of phenotype strengths in an siRNA screen against the human kinome in wild-type versus Ago2-overexpressing HeLaP4 cells. X and Y axes are the Euclidean distance (z-score normalized) of individual samples to the negative control in the two cell lines. The diagonal line represents samples showing equal magnitude of phenotypic effects in both cell lines, while points above the diagonal line are samples with stronger phenotypes in the Ago2 cells. That the vast majority of samples with significant phenotypes (z-score >2) and the positive controls distribute above the diagonal line exemplifies that phenotypes are stronger in the Ago2 cell line. See ‘Materials and Methods’ section for the control siRNAs. (F) Examples of target genes (rows) and parameters (columns, see Supplementary Table S2 for abbreviations) documenting improved knockdowns and phenotypes in Ago2-expressing (A2) as compared with wild-type (wt) cells. Values and colors represent Kolmogorov-Smirnov statistics: red means that a sample feature is larger than the control feature, green means the opposite and black indicates equal features. AURKB, Aurora kinase B; HIPK3, Homeodomain-interacting protein kinase 3. (G) Further documentation of enhanced phenotypes in the Ago2 cells. Shown are two representative siRNA targets (same as in F) with greater than 2-fold phenotypic distances in the Ago2 cell line. Colors represent actin (red), tubulin (green) and DNA/nuclei (blue). (H) Illustration of the higher RNAi assay reproducibility in the Ago2 cells as compared with the parental line (shown for two independent replicates each).

