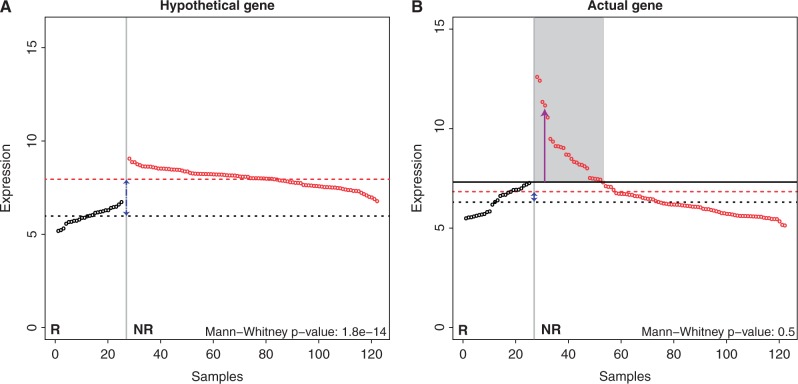
Figure 1.
Gene expression patterns of genes suitable for group-wise analyses and DIDS. (A) Expression levels across controls and cases for a hypothetical gene suitable for group-wise analysis. A conventional approach using, e.g. a Mann–Whitney test, would easily identify this gene. The black symbols represent samples in the control group and the red symbols the samples in the case group. The gene expression values have been sorted from low to high for the control group and from high to low for the case group. The dashed black (red) line represents the average gene expression in the control (case) group. (B) The expression levels of an actual gene we identified using DIDS. The maximum expression level in the control group is indicated by the solid black line. The bulk of the cases show expression levels similar to the control samples; however, a subgroup exists that shows expression levels that are above the maximum in the control group and clearly deviating from the expression levels in that group (shaded region). DIDS is designed to specifically detect these patterns.

