
Figure 2.

The difference in power between DIDS and other tested approaches for the scenario (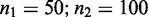 ). The differences are represented for all methods developed for imbalanced signals and the unequal variance t-test, as representative of conventional group-wise analyses. The methods are represented in the rows and the different values of Δ in the columns. For each combination of a method and a value of Δ, the power difference for DIDS and the method represented in the column are depicted as a function of
  (horizontal axis) and α (vertical axis). Shades of green represent settings where DIDS has more power than the other methods, whereas shades of red represent settings where DIDS has less power than the other methods.