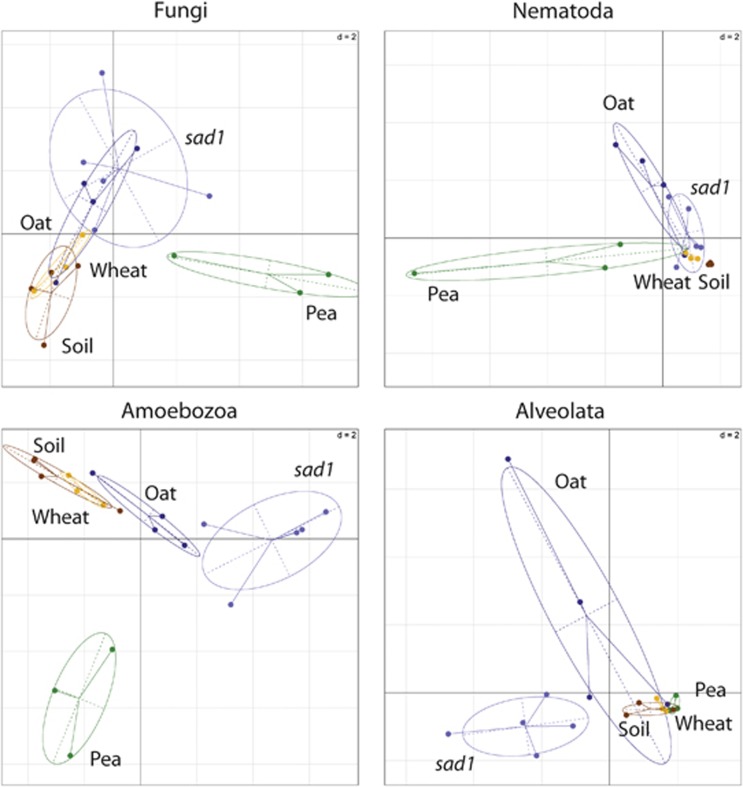
Figure 2.
Genus level differences between major eukaryotic groups (Figure 1c) in the rhizospheres as revealed by between-classes PCA. The ade4 R package (Dray and Dufour, 2007) was used to plot two principal components based on data from eukaryotic communities at genus level. The centre of gravity for each class of rhizosphere is given by the intersection of sample lines and the ellipse covers 67% of the samples belonging to that class. The closer two ellipses appear, the greater the similarity in their community makeup. The statistical significance of the between-classes PCA, as determined by a Monte-Carlo test (n=999), gave P<0.004 for Fungi, P<0.002 for Nematoda, P<0.001 for Amoebozoa and P<0.035 for Alveolata, indicating the existence of highly significant differences between the groups.

