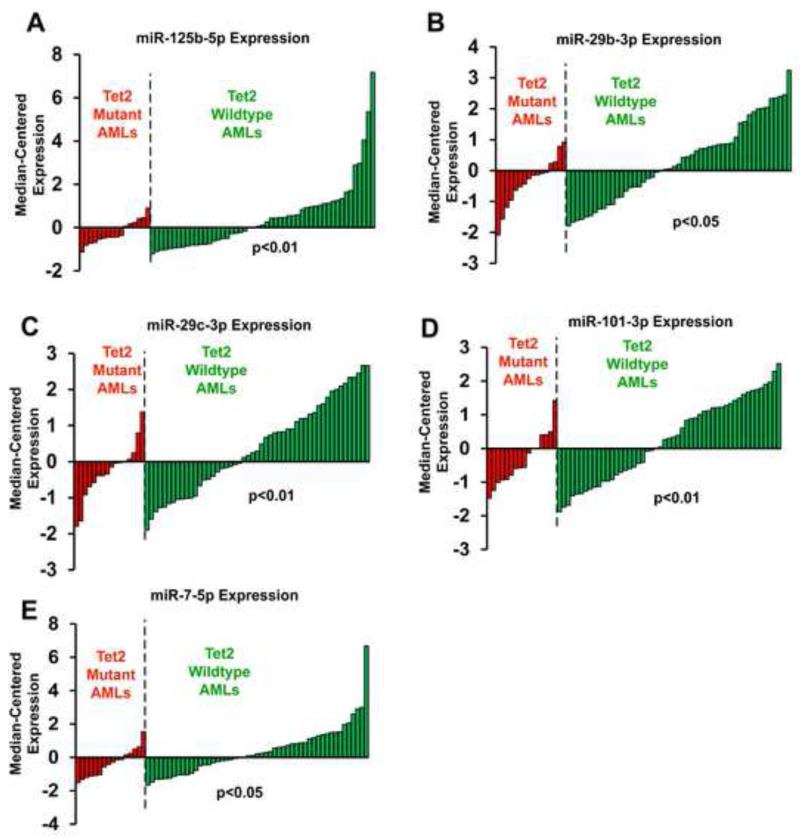
Figure 6. Preferential overexpression of TET2-targeting miRNAs in TET2-wildtype acute myeloid leukemia.
The expression of TET2-targeting miRNAs was measured in a cohort of 67 cytogenetically normal AMLs, among which 16 samples were TET2-mutant. Expression data were normalized by subtracting cohort median and dividing by median average deviation to reflect outlier expression patterns. The data for miR-125b-5p (A), miR-29b-3p (B), miR-29c-3p (C), miR-101-3p (D) and miR-7-5p (E) were plotted, with higher bars indicating higher expression. P values reflect the probability of observing more frequent higher expression for the indicated miRNA in TET2-wildtype AMLs than TET2-mutant AMLs. The specific cutoff applied for these p-values is examining the top 33% samples with the highest expression of the indicated miRNA. See also Figure S6 and Tables S3, S4 and S5.

