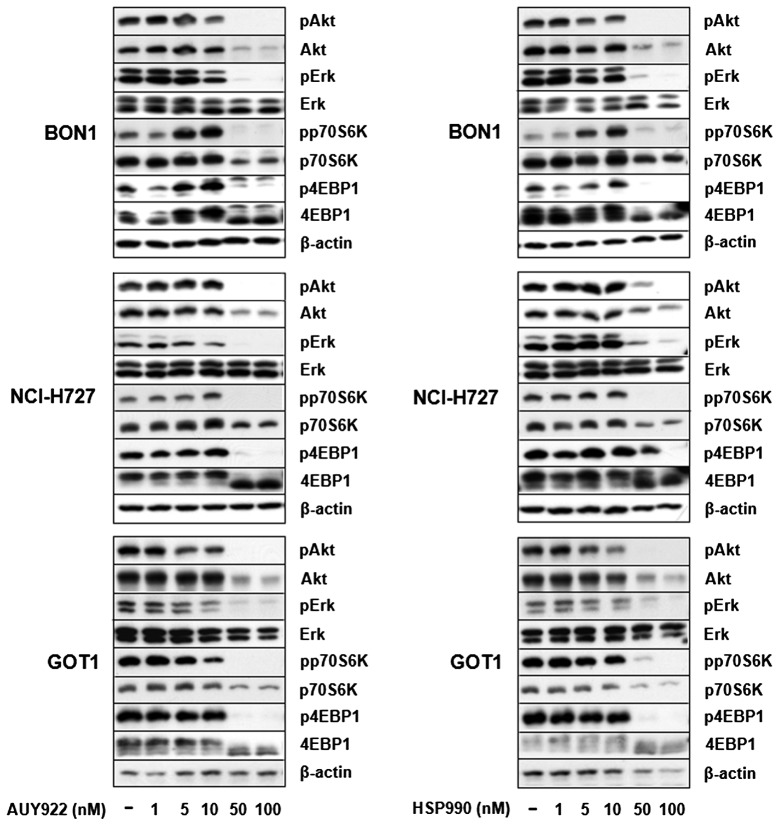
Figure 6.
Effect of HSP90 inhibition on downstream signaling. BON1, NCI-H727 and GOT1 cells were treated with increasing concentrations (1–100 nM) of the HSP90 inhibitor AUY922 (left panel) or HSP990 (right panel) for 24 h. Subsequently, the expression of pErk1/2, Erk1/2, pAkt, Akt, pp70S6K, p70S6K, p4EBP1 and 4EBP1 was evaluated by western blot analysis. A representative blot out of 3 independently performed experiments is shown.

