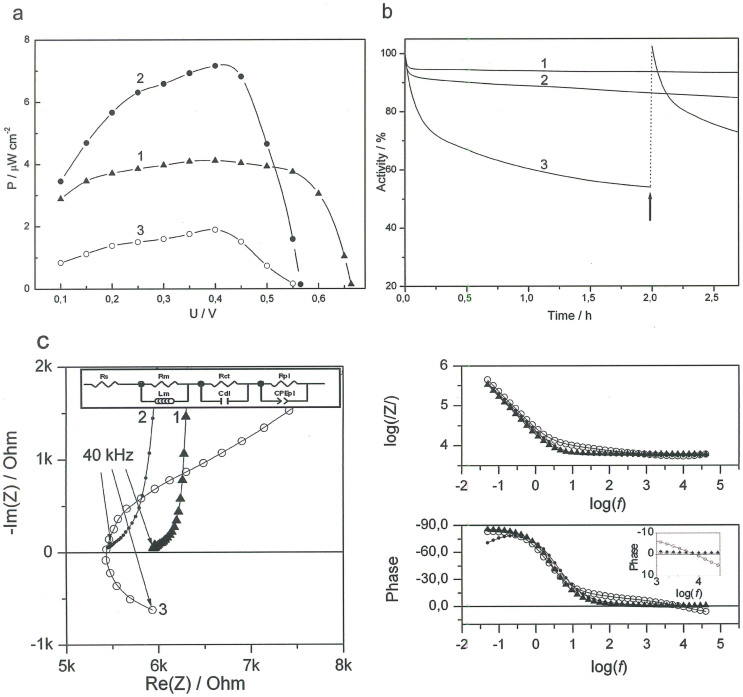
Figure 8. Enzymatic fuel cell characterisation.
(a) Typical power density plots of EFCs operating in buffer with 2.5 mM glucose (1), CSF (2), and rat brain (3). (b) Operational stability of EFCs operating in buffer with 2.5 mM glucose (1), CSF (2), and rat brain (3). At the time indicated by an arrow, a slight manipulation of the implanted electrodes was performed, moving them 0.1–0.2 mm. (c) Nyquist plots and Bode diagrams measured for EFCs in buffer (1, triangles), CSF (2, full circles), and rat brain (3, open circles). Insets: Equivalent circuit and magnified phase dependence. Rs – solution resistance, Rm – membrane resistance, Rct – charge transfer resistance, Rpl – resistance of distribution element impedance, Lm – membrane inductivity, Cdl – double layer capacity, CPEpl – constant phase element. Conditions: 50 mM PBS, pH 7.4; power density plots were obtained using both calibrated resistors of different resistance values and LSVs recorded with a scan rate of 0.3 mV s−1. The operational stability was measured at a constant load of 35.86 MΩ. Impedance measurements were done at U = 0.45 V and an amplitude of 10 mV.

