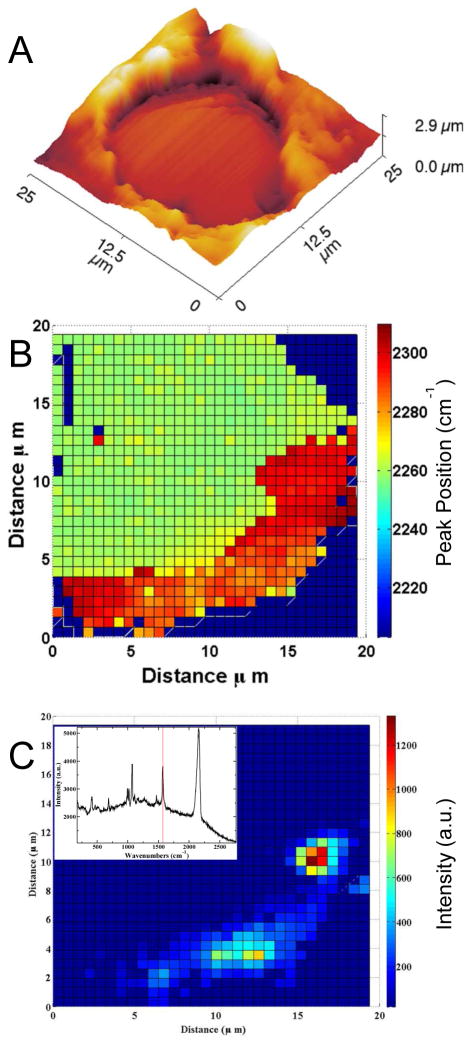
Figure 1.
A) The 3D AFM topography of an electrodeposited Au microelectrode is shown. B) The observed CN stretch frequency is mapped along the electrode. C) The Raman intensity of codeposited thiophenol is mapped along part of the same electrode shown in A. The inset shows the Raman spectrum at the highest intensity pixel in the thiophenol map at 1572 cm−1 (red line, inset).

