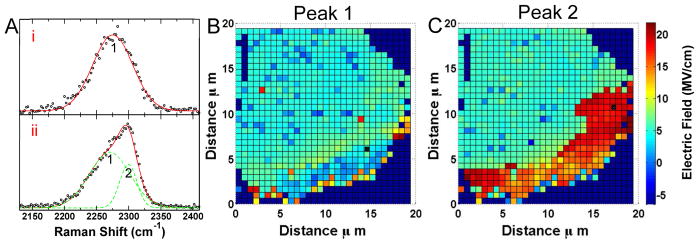
Figure 2.

A) Representative SERS spectra of cyanide and the resulting peak fits are shown from flat (i) and edge (ii) regions. The edge region shows an asymmetric peak that can be deconvolved into two peaks, peak 1 and 2. B) A map of the electric field determined from the frequency of peak 1 indicates a low electric field component across the surface. C) The larger CN frequency of peak 2 corresponds to more intense electric fields localized along the edge of the Au deposit. In the absence of an asymmetric lineshape, the single frequency observed is used in both plots. A black cross in (B) and (C) denote where the spectra (i) and (ii) were acquired, respectively.
