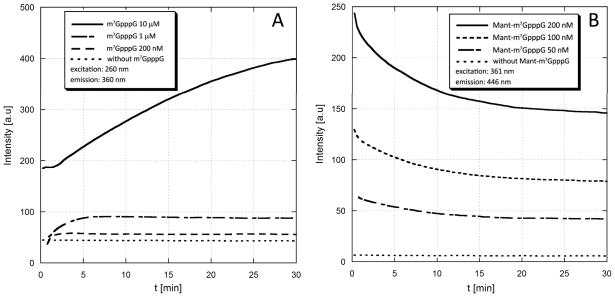
Fig. 5.
Monitoring the DcpS-catalyzed enzymatic hydrolysis of unlabeled (m7GpppG) and Mant-labeled (Mant-m7GpppG) cap analogues by spectrofluorymetry. (A). Unlabeled m7GpppG is cleaved by DcpS to m7GMP and GDP. The fluorescence intensity of the sample observed at the wavelength characteristic for m7G moiety (ex.=260 nm, em.=360 nm) increases along with reaction progress because in the dinucleotide (m7GpppG) fluorescence of m7G is partially quenched by intramolecular stacking between m7G and G. The fluorescence changes were sufficient to monitor reaction progress at concentration of 1 μM or higher(B) Mant-m7GpppG (2) is cleaved by DcpS to Mant-m7GMP and GDP. The fluorescence intensity of the sample observed at the wavelength characteristic for Mant moiety (ex.=361 nm, em.=446 nm) decreases along with reaction progress because the fluorescence of Mant in dinucleotide is enhanced by intramolecular interactions with hydrophobic parts of the second nucleoside (guanosine). The fluorescence changes were sufficient to monitor reaction progress at concentration of 50 nM or higher, i.e. 20-fold lower than for unlabeled m7GpppG. The DcpS concentration was 20 nM (experiment with m7Gp3G) or 200 nM (experiment with Mant-m7GpppG).

