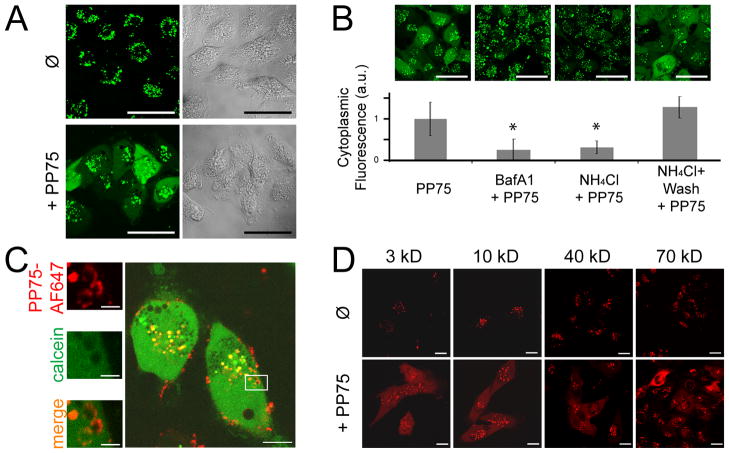
Fig. 2. PP75 trafficking and pore formation in endosomes.
(A) U251 cells were incubated with the green fluorescent dye calcein in the absence (Ø) or presence (+PP75) of PP75 for 30 min. Confocal fluorescence microscopy images are shown on the left and the corresponding transmitted light images are shown on the right. Only in the presence of PP75 is there endoplasmic release and subsequent cytoplasmic localization of calcein as indicted by the diffuse green staining pattern. Scale bars represent 50 μm. (B) U251 cells were treated with the endosomal acidification inhibitors BafA1 or ammonium chloride (NH4Cl) prior to incubation with calcein and PP75. Representative confocal fluorescence microscopy images shown across the top indicate that inhibition of endosomal acidification inhibits cytoplasmic calcein staining. Restoration of endosomal acidification activity in NH4Cl pre-treated cells by washout of NH4Cl one hour prior to incubation with calcein and PP75 restores cytoplasmic calcein staining. Scale bars represent 50 μm. Below each microscopy image is the relative cytoplasmic fluorescence intensity in arbitrary units (a.u.) of correspondingly treated cells. For each condition, 160 randomly selected cells were analyzed and a mean value was calculated. Asterisks indicate p < 0.05 in comparison to calcein + PP75 alone (PP75) (student’s t test). (C) Cells were treated with calcein (green fluorescence) and PP75-AF647 (red fluorescence). Calcein present within endosomes is represented by punctate staining while calcein present in the cytoplasm is represented by diffuse staining (larger photograph shown on left). Intracellular PP75-AF647 staining is present almost exclusively in circular clusters and this is more consistent with pore formation within otherwise intact endosomes than complete rupture of endosomes (magnified views of inset shown on right). The scale bar represents 30 μm in the left side image and 2 μm in the right side images. (D) Cells were incubated with TMR-labeled dextrans (red fluorescence) ranging in size from 3kD to 70 kD. In the absence of PP75 (Ø), even the smallest tested dextrans remain localized within endosomes and are not visualized in the cytoplasm. In the presence of PP75 (+PP75), even the largest tested dextrans are released into the cytoplasm. The scale bar represents 20 μm.

