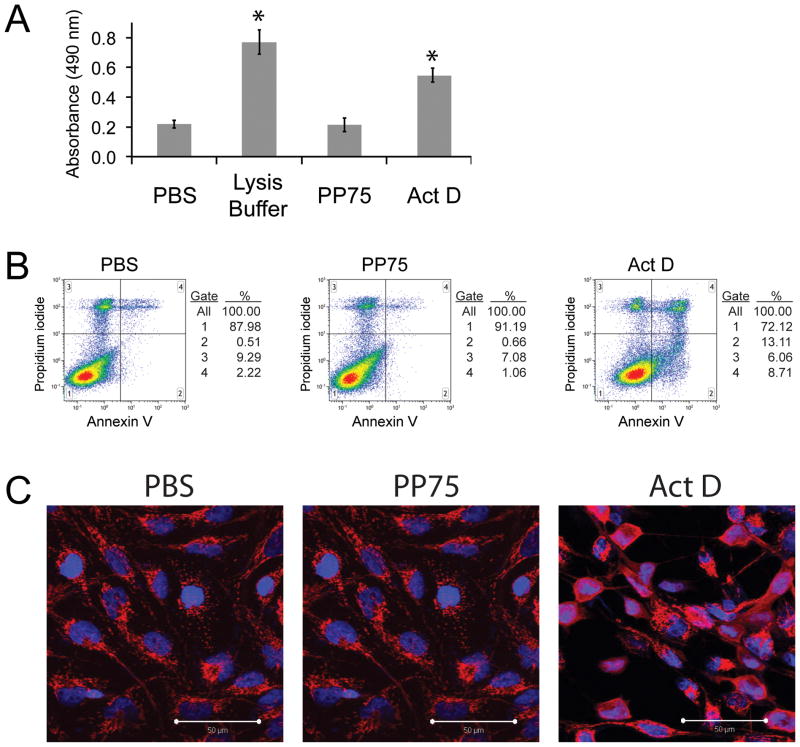
Fig. 3. Viability and apoptosis analyses.
(A) Lactate dehydrogenase (LDH) release assay. Cells incubated with PBS control, a detergent cell lysis buffer, PP75 or actinomycin D (Act D – an apoptotic agent) were assessed for the release of cytoplasmic LDH into the culture medium. LDH in the culture medium was assessed by the addition of a substrate that is enzymatically converted to a product that absorbs 490 nm wavelength light (y-axis). Complete lysis of cells with detergent results in the relative maximal LDH release value. There is no significant difference in the amount of LDH released from PBS and PP75 treated cells. Asterisks indicate a significant difference in LDH release in comparison to PBS alone (p < 0.05; student’s t test). (B) FACS analyses of PI and annexin V staining. Two color FACS histograms of cells incubated with PBS control, PP75 or Act D (a positive control) are shown. The y-axis represents the intensity of propidium iodide staining and is an indicator of plasma membrane compromise and/or cell death. The x-axis represents the labeling of cells with fluorescently tagged annexin V, which binds to apoptotic cells. There are no significant differences in the percentages of PI labeled cells (gates 3 and 4) or annexin V labeled cells (gates 2 and 4) in PBS and PP75 treated cell populations. In contrast, there is a large increase in the percentage of PI and annexin V labeled cells in Act D treated cultures. Experiments were performed in triplicate and representative results are shown. (C) Cytochrome C staining. Cells treated with PBS control, Act D or PP75 were assessed for apoptosis by staining with anti-cytochrome C antibodies followed by red fluorescently labeled secondary antibodies. Cytochrome C is contained within mitochondria in healthy cells and displays a punctuate or granular staining pattern as seen in the PBS and PP75 treated cells. In cells undergoing apoptosis, cytochrome C is released into the cytoplasm and this results in a homogenous staining pattern as seen in the Act D treated cells. Cells were counterstained with DAPI to reveal cell nuclei (blue) and the scale bar in the lower right hand corner represents 50 μm.

