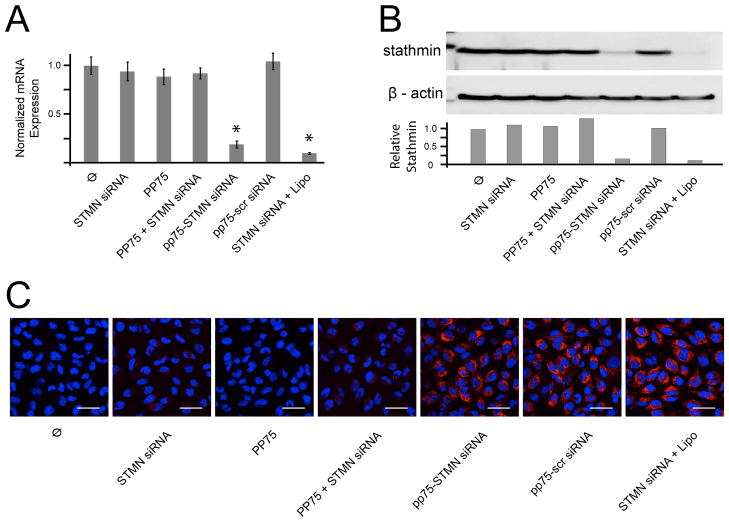
Fig. 4. PP75-stathmin siRNA delivery in vitro.
(A) Relative stathmin mRNA expression levels for untreated control cells (Ø) and cells treated with stathmin siRNA alone (STMN siRNA), PP75 alone (PP75), PP75 plus stathmin siRNA without conjugation (PP75+STMN siRNA), PP75-stathmin siRNA conjugates (PP75-STMN siRNA), PP75-scrambled siRNA conjugates (PP75-scr siRNA) or stathmin siRNA plus Lipofectamine (STMN siRNA + Lipo). Values shown are the average of three experiments with error bars representing the standard deviation. Asterisks indicate p < 0.002 in comparison to untreated cells. (B) Stathmin protein expression for U251 cells treated as in Fig. 4A were determined by immunoblotting using an anti-stathmin antibody. Relative signal intensity of stathmin bands compared to β actin protein loading control bands are shown below the immunoblot image. Blots were performed in triplicate and representative results are shown. (C) Fluorescence microscopic visualization of U251 cells treated as in (A) except siRNAs were Cy3-labelled (red fluorescence). Nuclei are labeled with Hoechst 33342 (blue fluorescence). Experiments were performed in triplicate and representative views are shown. The white scale bars represent 50 μm.

