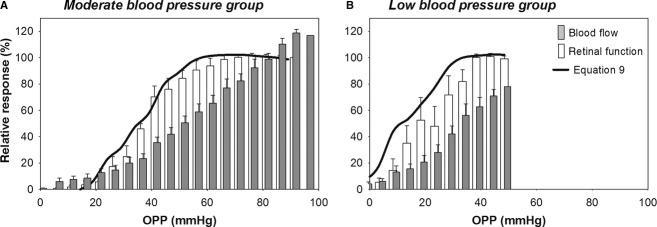
Figure 7.

Implementing the model (eq. 9) in rats with moderate (A) and low blood pressure (B). The experimental data are replotted from a previous study (He et al. 2012) as shown in Figure 1. All parameters (“a”, “b”, “t” and “m”) were previously optimised in the high blood pressure group in Figure 1 as given in Table 1.
