
Figure 4.
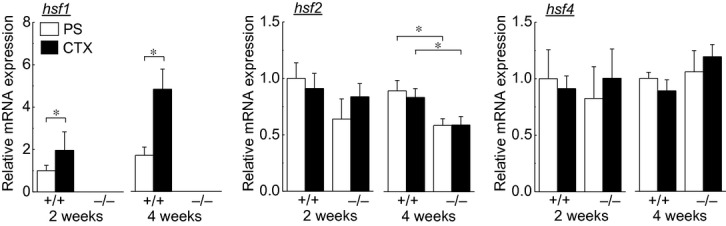
Changes in the mean expression levels of heat shock transcription factor (HSF) 1, HSF2, and HSF4 mRNAs in soleus muscle during the experimental period. hsf1, HSF1 mRNA; hsf2, HSF2 mRNA; hsf4, HSF4 mRNA. See Figure 1 for other abbreviations. Values are means ± SEM. n = 5–6/group at each time point. *P < 0.05.