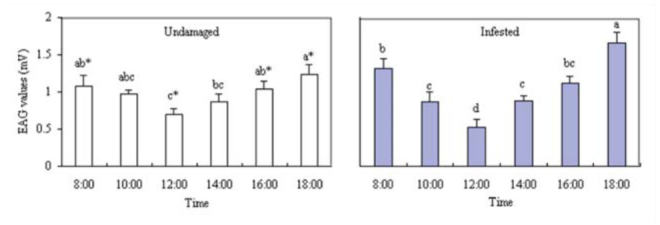
Figure 5.

EAG responses of Batocera lineolata unmated females to VOCs from Viburnum awabuki at different times. White bars (undamaged plants) marked with the same lowercase letter were not significantly different. Grey bars (infested plants) marked with the same lowercase letter were not significantly different (ANOVA followed by LSD, p < 0.05). Asterisks signify a significant difference between undamaged and infested plants (t-test, p < 0.05). Error bars ± SE (n = 6). High quality figures are available online.
