
Figure 3.
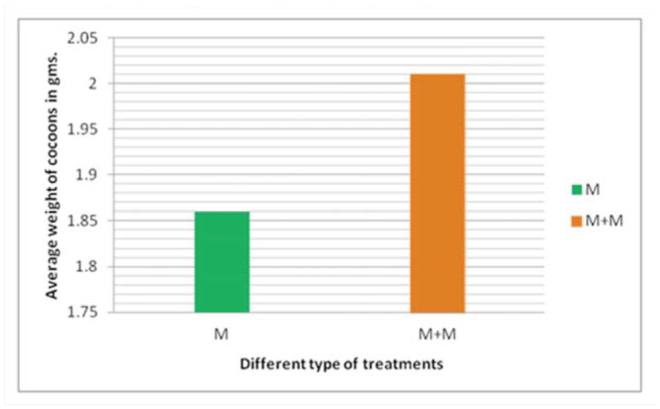
The relationship between the weights of the cocoons at the end of the fifth instar when larvae were fed with fresh mulberry (M) and mulberry leaves dipped in milk (M+M). The X-axis in the graph indicates the different treatments. The Y-axis indicates the average weight of the 20 cocoons. High quality figures are available online.