Figure 1.
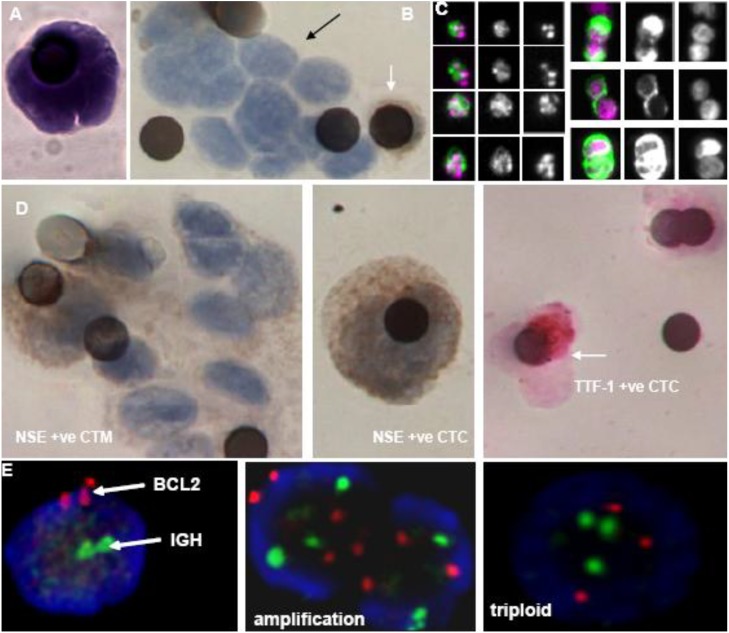
Characterization of CTCs. CTCs isolated from SCLC patients by either the Veridex CellSearch Platform or isolated by ScreenCell ISET size exclusion. Panel A shows a single CTC, isolated by ISET and stained by H&E, with high nuclear to cytoplasmic ratio, cell size >8 µm (the pore size of membrane) and irregular nuclear shape. Panel B shows a SCLC CTM (black arrow) isolated by ISET alongside a leukocyte positively stained brown for CD45 (white arrow). Panel C demonstrates that the DAPI nuclear staining can identify apoptosis (left panel) and nuclear morphology consistent with mitosis (right panel) of CTCs detected by the CellSearch. Panel D SCLC associated diagnostic biomarkers, NSE and TTF-1 were immunohistochemically stained with white blood cells used as internal negative control to further confirm the identity of ISET isolated CTM and CTCs Panel E shows FISH analysis to detect bcl-2 genetic abnormalities such as amplification and triploidy from SCLC CTCs. Blood samples were collected from SCLC patients undertaking chemotherapy at the Christie Hospital, Manchester UK according to ethically approved protocols.

