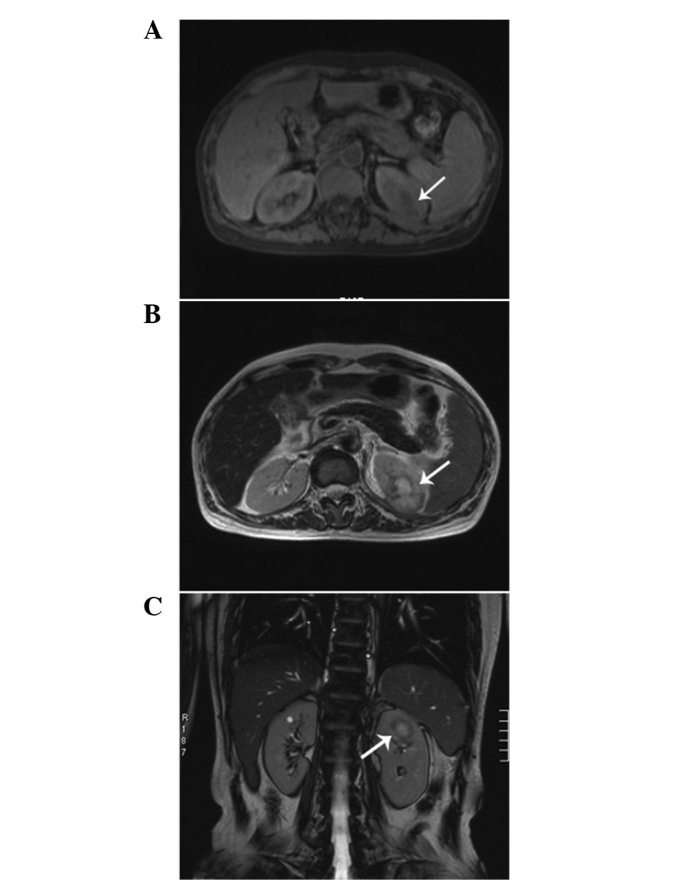
Figure 2.

Magnetic resonance imaging demonstrating a heterogeneous mass measuring 2.6 cm. (A) Low intensity on T1-weighted images (arrow). (B and C) High intensity, accompanied by hypointensity surrounding the center of the lesion, on T2-weighted images (arrow).
