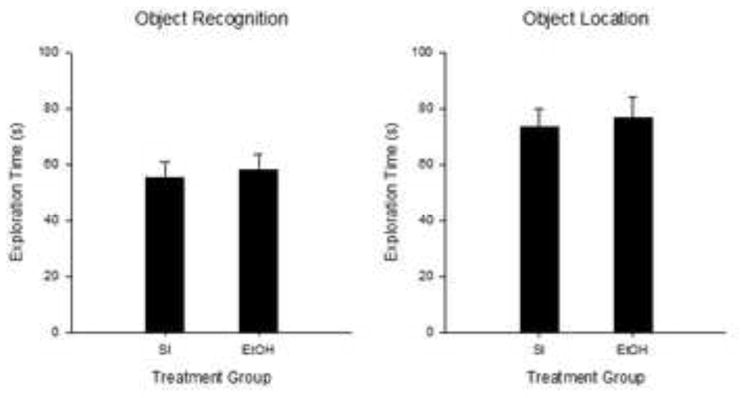
Figure 10.

Mean (+/− SE) Exploration time (s) during the 5-min Sample Phase for Experiment 3. OR (left panel) and OL tasks (right panel). No significant differences were found between treatment groups for either task. OR, SI n=23; 5.25g n=19; OL, SI n=25; 5.25g n=19.
