
Figure 11.
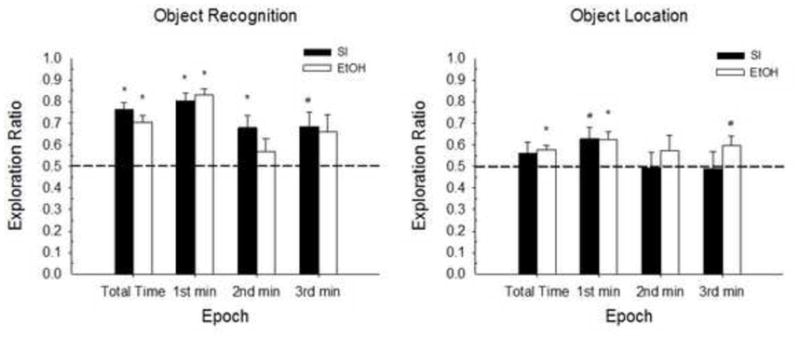
Mean (+/− SE) Exploration ratios during the 3-min Testing Phase for Experiment 2. OR (left panel) and OL tasks (right panel). From left to right, Epoch includes total testing time, 1st min, 2nd min and 3rd min. Both treatment groups show significant preference for the novel object and novel location. Group n s for the total time, 1st min, 2nd min and 3rd min of testing for OR: SI n=23, 23, 20, 21; 5.25g n=19, 19, 18, 17 and OL: SI n=25, 23, 23, 23; 5.25g n=19, 19, 18, 19. Dotted line indicated chance performance. Significant differences from chance performance are indicated for each group (*p < .01; #p < .05).