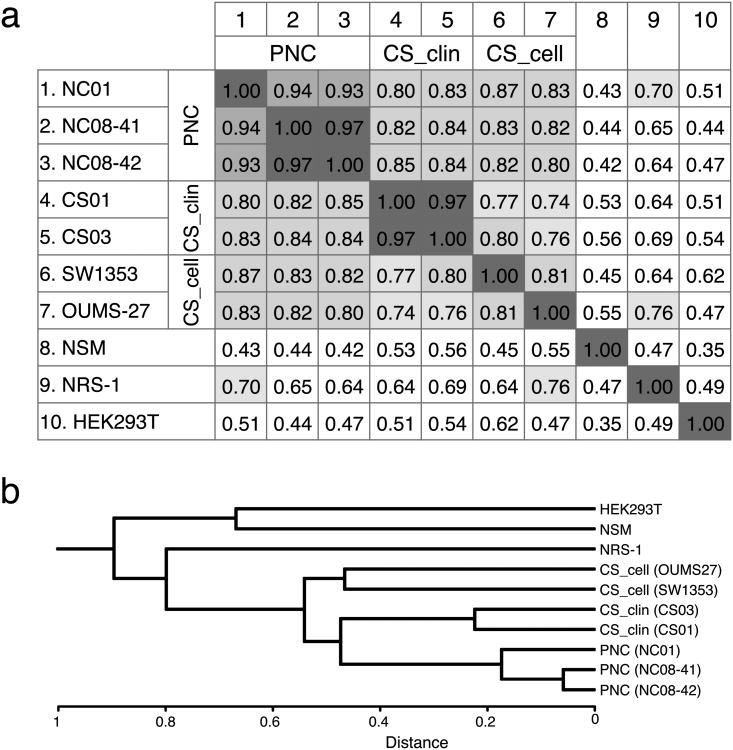
Figure 1.
Correlations between samples on the miRNA arrays. (a) Correlation matrix for log-intensity among samples. (b) Hierarchical clustering of the arrays. The dendrogram shows the degree of similarity of miRNA expression pattern among samples. The chondrogenic samples, including both chondrosarcoma clinical samples and chondrosarcoma derived cell lines, showed a distinct expression pattern in miRNA from primary non-tumorous chondrocyte derived samples. CS_clin = chondrosarcoma clinical sample; CS_cell = chondrosarcoma derived cell line; PNC = primary non-tumorous articular chondrocytes.

