
Figure 7.
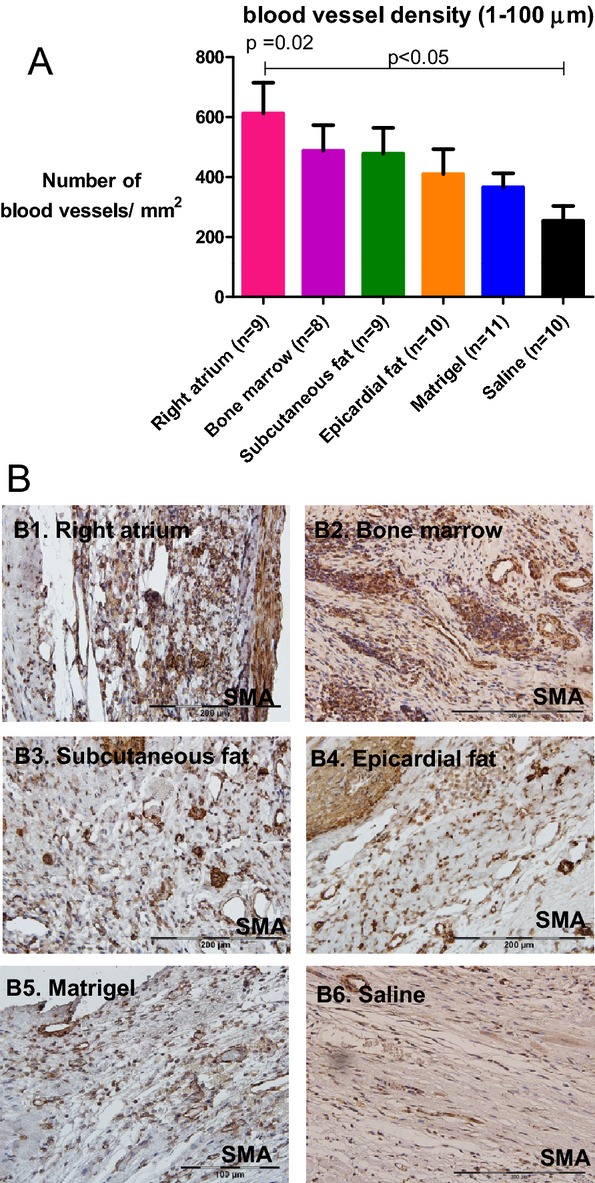
Diverse vascularization effect of hMSCs from different locations after transplantation in rats. A, Vessel density was determined by the number of smooth muscle actin positive vessels per mm2 in the infarct zone of the different groups (3 sequential pictures were taken per rat). B1 through B6, Representative microscopic images from each group. Vessel density was greater in rats treated with right atrial hMSCs 27 days after injection compared with saline‐treated rats (P=0.02 for all groups; P<0.05 for right atrium vs. saline). Data are means±SEM. hMSCs indicate human mesenchymal stromal cells.