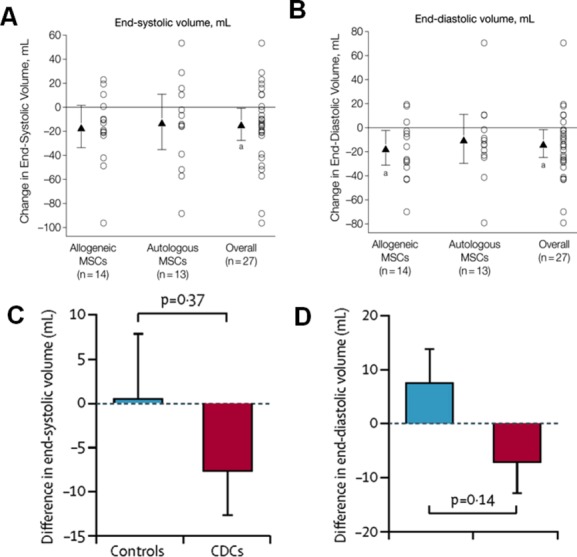
Figure 4.

Comparison of end‐systolic and end‐diastolic volumes in POSEIDON and CADUCEUS trials. A and B, Chamber volumes in POSEIDON trial. Mean changes from baseline to 13 months are noted by triangles and depict changes in cardiac phenotype assessed by cardiac MDCT scan. Error bars indicate 95% CIs. Individual patient changes from baseline are shown as circles. Shown are changes in cardiac volumes from baseline to 13‐month follow‐up in allogeneic, autologous, and overall patient groups. Within‐group P values are noted as a P<0.05. C and D, Chamber volumes in CADUCEUS study participants. C, Treatment effects (baseline vs 6 months) for end‐systolic volume. D, Treatment effects (baseline vs 6 months) for end‐diastolic volume. Panels A and B are reproduced with permission from Hare et al, JAMA, 2012.1 Panels C and D are reproduced with permission from Makkar et al, Lancet, 2012.5 CADUCEUS indicates Cardiosphere‐Derived aUtologous stem Cells to reverse ventricUlar dySfunction; CDCs, cardiosphere‐derived cells; CIs, confidence intervals; MDCT, multi‐detector computer tomography; MSCs, mesenchymal stem cells; POSEIDON, PercutaneOus StEm Cell Injection Delivery Effects On Neomyogenesis.
