
Figure 8.
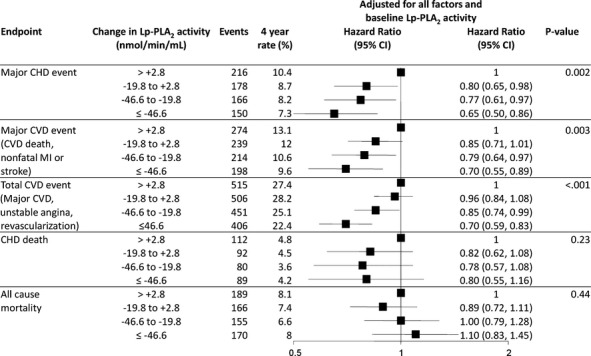
Quartiles of change in Lp‐PLA2 activity and prediction of CVD events. HR and 95% CI are adjusted for baseline variables: treatment, sex, stroke, diabetes, smoking, hypertension, total cholesterol, apolipoprotein B and A1, HDL‐C, age, nature of prior ACS, timing of coronary revascularization, SBP, atrial fibrillation, eGFR, BMI, dyspnea class, angina grade, WBC, peripheral vascular disease, triglycerides, fasting glucose, aspirin at baseline and change in LDL. ACS indicates acute coronary syndromes; BMI, body mass index; CHD, coronary heart disease; CVD, cardiovascular disease; eGFR, estimated glomerular filtration rate; HDL‐C, HDL cholesterol; HR, hazard ratio; Lp‐PLA2, lipoprotein‐associated phospholipase A2; MI, myocardial infarction; SBP, systolic blood pressure; WBC, white blood cell count.