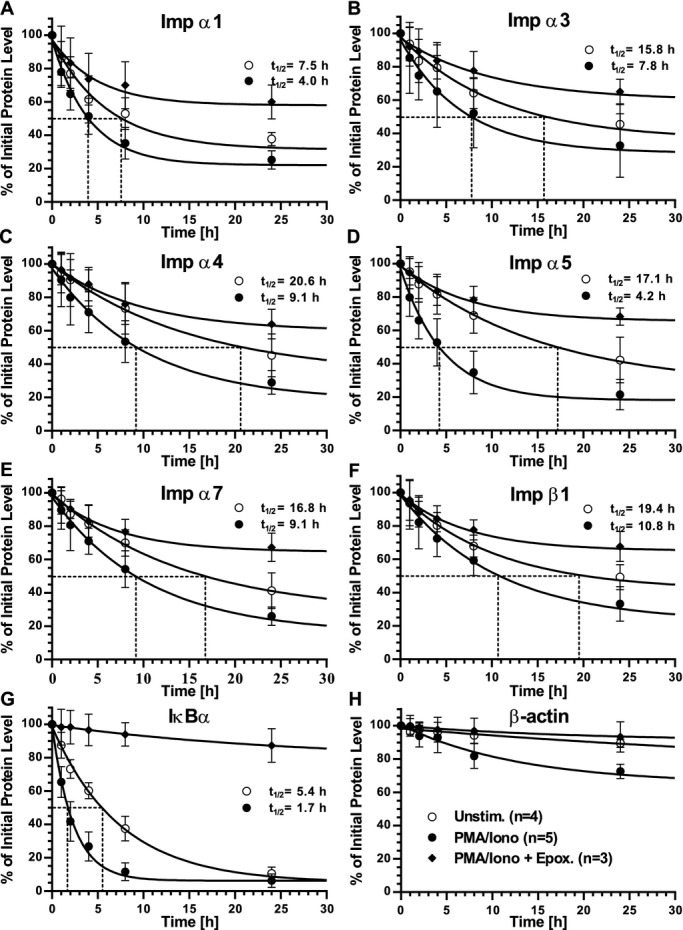
Figure 1.

t1/2 of endogenous importins in Jurkat T cells. Graphic representation of quantitative immunoblot analyses of A, Imp α1; B, Imp α3; C, Imp α4; D, Imp α5; E, Imp α7; F, Imp β1; G, IκBα; and H, β‐actin in whole cell lysates from Jurkat T cells. Cells were left unstimulated (open circles), stimulated with PMA/Iono (solid circles), or stimulated with PMA/Iono after pretreatment with the proteasome inhibitor epoxomicin (solid diamonds). Please see (H) for symbol key. All cells were first pretreated with cyclohexamide to block de novo protein synthesis. Protein levels were quantified by immunoblotting and values at each time point normalized to β‐actin at that same time point, then calculated as a percentage of endogenous protein at t0. Dotted lines indicate t1/2. Results are shown as the mean±SD of at least 3 independent experiments. Imp α indicates importin α; Iono, ionomycin; PMA, phorbol 12‐myristate 13‐acetate; SD, standard deviation.
