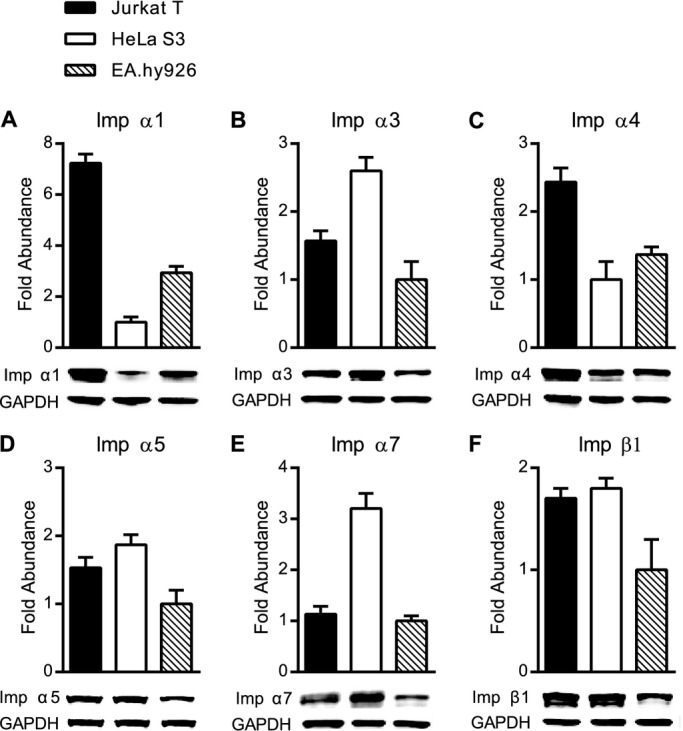
Figure 4.

Relative abundance of endogenous importins in Jurkat T cells, HeLa S3 cells and EA.hy926 cells. A through F, Endogenous proteins in whole cell lysates from unstimulated cells were analyzed by quantitative immunoblotting and the abundance of each was calculated after normalization to GAPDH controls. For each importin, the cell type with the least abundance of that importin was set to 1.0 and the relative fold abundance of this importin in the remaining cell types is indicated. The same amount of total lysate protein from all 3 cell types was used for analysis, but was adjusted empirically for each importin based on general abundance of that importin as well as its antibody sensitivity. A, Imp α1, 6 μg; B, Imp α3, 23 μg; C, Imp α4, 17 μg; D, Imp α5, 34 μg; E, Imp α7, 23 μg; and F, Imp β1, 34 μg of total lysate protein was loaded for each cell type. Results are shown as the mean+SD from 3 independent experiments. Imp α indicates importin α; SD, standard deviation.
