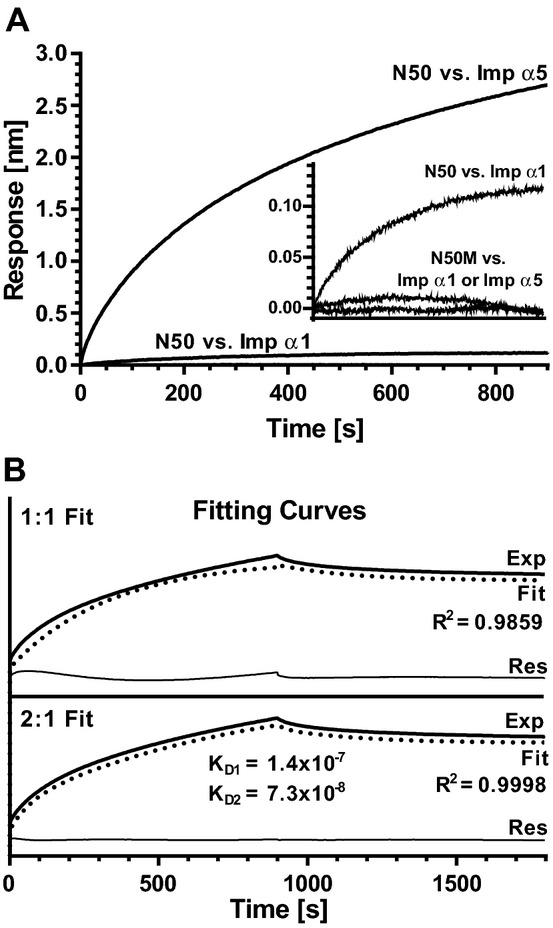
Figure 6.

A bio‐layer interferometry (BLI) assay indicates that N50 peptide displays high binding affinity for Imp α5, but not Imp α1. Biotinylated N50 or its non‐binding mutant control N50M immobilized on SA‐coated biosensors were incubated at 30°C with 50, 100, 150 or 200 nmol/L solutions of GST‐tagged Imp α1 ΔIBB, GST‐tagged Imp α5 ΔIBB or GST alone. A, Association curves of N50 peptide with Imp α1 at 200 nmol/L and with Imp α5 at 200 nmol/L, normalized by subtracting N50 peptide binding with GST at 200 nmol/L. Association curves of N50M mutant peptide with Imp α1 and Imp α5, both at 200 nmol/L, normalized by subtracting N50M mutant peptide binding with GST at 200 nmol/L are shown in the inset panel, along with the binding isotherm for N50 peptide with Imp α1 at 200 nmol/L, for comparison. B, Fitting curves corresponding to a 1:1 (upper) or 2:1 (bottom) binding stoichiometry for interaction between N50 and Imp α5. Exp, recorded signal (heavy solid line); Fit, simulation curve (dotted line); Res, residual curve (thin solid line, Exp minus Fit). Each graph is representative of 3 independent experiments. Binding affinities were calculated using data from all concentrations of proteins in all 3 experiments. IBB indicates importin β binding; Imp α, importin α; GST, glutathione S‐transferase; SA, streptavidin.
