
Figure 2.
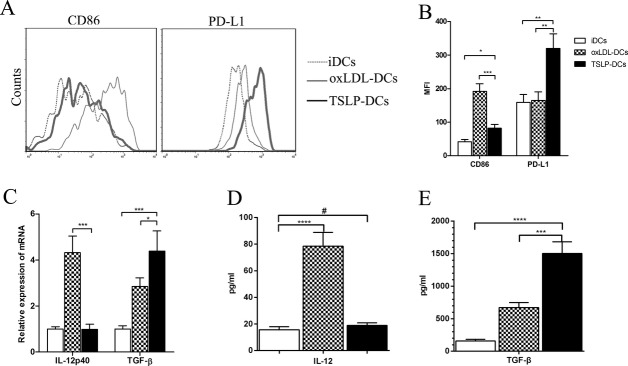
Characterization of TSLP‐DCs. A, After being cultured for 2 days under different conditions, BM‐DCs (2×10⁵ cells/well) were stained with specific antibodies against CD86 and PD‐L1 and analyzed by FACS. B, Mean fluorescence intensities (MFIs) for CD86 (*P=0.0156, ***P=0.0002) and PD‐L1 (**P=0.0030 for both) were quantified. C, Quantitative PCR analysis of IL‐12 (***P=0.0003) and TGF‐β (*P=0.0135; ***P=0.0008) for the DCs in different groups. D, Quantification of IL‐12 by ELISA in the supernatants of each group (#P=0.5435). E, Quantification of TGF‐β by ELISA (***P=0.0002). Data are shown as the average±SD of 3 to 5 independent experiments. ****P<0.0001. BM indicates bone marrow; DCs, dendritic cells; ELISA, enzyme‐linked immuno sorbent assay; FACS, fluorescence‐activated cell sorting; IL, interleukin; oxLDL, oxidized low‐density lipoprotein; PCR, polymerase chain reaction; PD‐L1, programmed death ligand 1; SD, standard deviation; TGF‐β, transforming growth factor‐β; TSLP, thymic stromal lymphopoietin.