Figure 3.

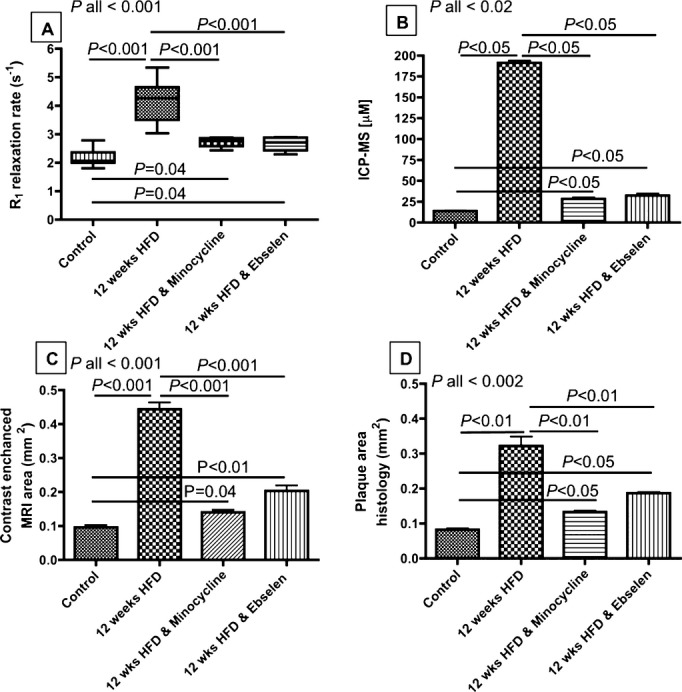
Quantitative MRI and histological analysis. A, R1 increased in atherosclerotic ApoE−/− mice and decreased in the minocycline‐ and ebselen‐treated animals. B, ICP‐MS calculation of gadolinium concentration within the vessel wall. C, Contrast‐enhanced vessel wall area. D, Histological assessment of plaque burden. P values between groups relate to an ANOVA test with a Bonferroni correction (for A and C) and to a Kruskal–Wallis test followed by a Dunn's post hoc test (for B and D). ANOVA indicates analysis of variance; HFD, high‐fat diet; ICP‐MS, inductively coupled mass spectrometry; MRI, magnetic resonance imaging.
