Figure 2.

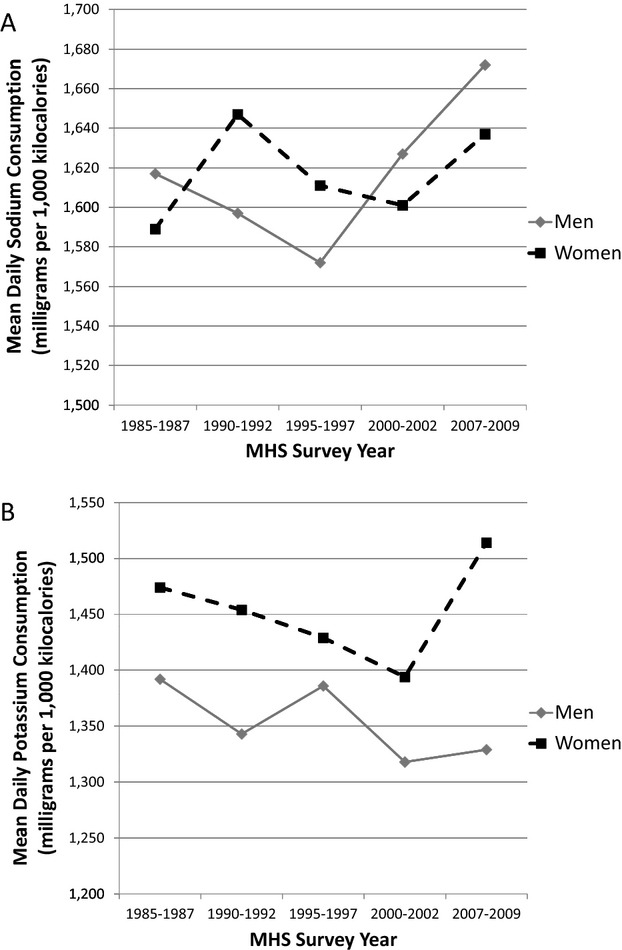
Sex‐specific mean daily sodium (A) and potassium (B) consumption (mg) per 1000 kilocalories, Minnesota Heart Survey (MHS), 1985–1987 through 2007–2009.

Sex‐specific mean daily sodium (A) and potassium (B) consumption (mg) per 1000 kilocalories, Minnesota Heart Survey (MHS), 1985–1987 through 2007–2009.